Methods
Visualization Tools
Shelley Rose
This lab focuses on ways to display connections and visualize text analysis for your digital humanities projects.
Natural Language Modeling
Natural language modeling takes a corpus (written text) and creates word clouds, trends and other visualizations.
Voyant is an excellent basic tool for language modeling. You can read the overview at the Digital Humanities Toolkit: https://dh.sites.gettysburg.edu/toolkit/tools/voyant-tools/
Work with Voyant and post your visualizations to Pressbooks.
- Visit https://voyant-tools.org/
- Enter a “corpus” into the box. This can be the text of a speech, flyer, letter or similar textual document. It could also be the text from many documents combined into the same file. Voyant doesn’t care about formatting, just that the input is text.
Corpus Samples
- Bertha von Suttner, Lay Down Your Arms! (1889) at Project Gutenberg https://www.gutenberg.org/files/49294/49294-h/49294-h.htm
- Click “reveal.” Explore the visualizations. How might you use them in your exhibit?
- Hover over a visualization. Click on “export a URL….” which is a rectangle with an arrow.
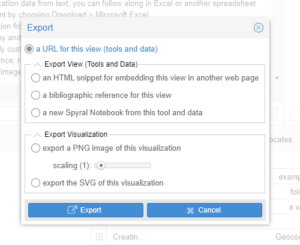 Choose “An HTML Snippet” under the “export view.” Embed the HTML in your Pressbook chapter using the “text” tab as we have in previous labs.
- Save and view in your chapter to confirm functionality.
Network Diagrams
Onodo (https://onodo.org/)
Onodo is a free network visualization tool. This tutorial by the Digital Humanities Toolbox has instructions for creating an Onodo visualization. https://dh.sites.gettysburg.edu/toolkit/tools/onodo/
