PART 2: METHODOLOGIES, PRINCIPLES AND TOOLS
6 Chapter 6: The DMAIC Methodology
Introduction
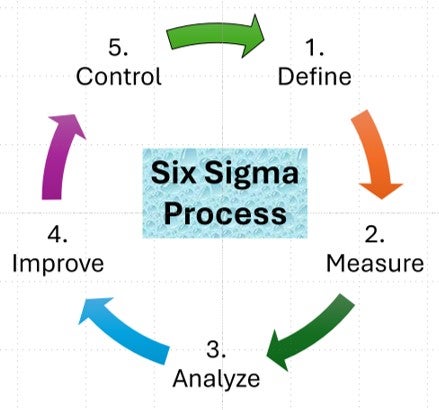
The DMAIC methodology is a cornerstone of Lean Six Sigma, a data-driven approach to improving processes and enhancing operational excellence. DMAIC stands for Define, Measure, Analyze, Improve, and Control. Each phase serves a specific purpose and is crucial to solving problems systematically and sustainably. This chapter covers each phase of the DMAIC methodology, demonstrating how it can be applied to real-world problems to drive operational excellence.
Learning Objectives
- Describe the five phases of the DMAIC problem-solving approach: Define, Measure, Analyze, Improve, and Control.
- Apply the DMAIC methodology to identify, analyze, and solve problems.
- Demonstrate how DMAIC can drive operational excellence.
Learning Outcome:
Apply the DMAIC methodology to identify, analyze, and solve problems and drive operational excellence.
Topics:
The DMAIC Methodology Phases
- Define
- Measure
- Analyze
- Improve
- Control
Using DMAIC for Operational Excellence
1. Define
Purpose
The primary goal of the Define phase is to clearly articulate the problem, set objectives, and identify the scope of the project. In this phase, the project goals and customer (internal and external) deliverables are clearly defined. It involves identifying a problem, considering the voice of the customer, and setting meaningful targets for improvement.
Key Activities
- Project Charter: The project charter outlines the project’s purpose, scope, and objectives. It includes the problem statement, project goals, timeline, and team members who will be involved.
- Voice of the Customer (): Gathering and understanding customer requirements and expectations are essential. Examples of data include customer complaints, returns/warranties, (NPS), the customer satisfaction index, and customer retention rate. Data collection methods include surveys (online, telephone, or in person), focus groups, customer interviews, and an analysis of customer complaints and support tickets (see Appendix, Chapter 6 for a process to make VOC data actionable).
- Critical to Quality () Elements: Identifying CTQ elements that are crucial to meeting customer needs help to define the project’s focus.
CTQ measures vary, depending on the industry and process; however, some typical categories include the following:
Quality Measures: Defect rate, first pass yield, scrap rate, claims
Time-based Measures: Cycle time, lead time, on-time delivery rate, response time, Takt time
Cost Measures: Cost per unit, total cost of ownership, operating costs
Data Collection Methods
Collecting accurate data for CTQs is crucial. Below are some common methods:
- Automated Data Collection: Using sensors and s to capture real-time process data, leveraging existing or systems to extract production data
- Manual Data Collection: Check sheet and tally sheet for defect counting, time studies for cycle time measurements, sampling plan for quality inspection
- Financial Data Collection: Cost accounting system, time tracking software for labor cost, inventory management system for material costs
Important Items to Consider When Collecting CTQ Data
- Sample size: Ensure enough data is collected to be statistically significant.
- Measurement system analysis: Verify that the measurement system is capable and consistent.
- Data integrity: Implement checks to ensure data accuracy and completeness.
- Frequency: Determine how often data needs to be collected to capture process variations.
Carefully select the relevant CTQ measures and implement robust data collection methods. In this way, Six Sigma practitioners can effectively drive process improvements that directly impact customer satisfaction and business performance.
Tools and Techniques
- SIPOC Diagram: A high-level process map that outlines the Suppliers, Inputs, Processes, Outputs, and Customers. Watch the video below[1] (24 minutes):
https://youtube.com/watch?v=i_JcH1Y8Ka4%3Fsi%3D0e24cXpUqm6xVHHD
Study Questions
- What is the recommended number of steps for a SIPOC Diagram?
- What is Tip #2?
- Stakeholder Analysis: Identify all stakeholders and their needs to ensure their expectations are managed.
- Project Charter: Draft a formal document that summarizes the project’s purpose, objectives, and scope (see Appendix, Chapter 6 for a sample project charter).
Example
A manufacturing company identifies a high defect rate in its production line. During the Define phase, the team develops a project charter, conducts VOC analysis through customer feedback to determine what is failing, and identifies CTQ elements related to product quality, such as internal failure rates.
Measure
Purpose of the Measure Phase
In this phase, the current performance of the process is measured. This serves as a baseline for future comparison. It involves identifying the key performance indicators (KPIs), gathering data, and understanding the process and its performance. The Measure phase aims to quantify the problem, and it involves collecting data to establish baseline performance and identify the extent of the issue.
Key Differences between KPI, VOC, and CTQ
Focus:
- KPI: focus is on overall business performance
- VOC: focus is on customer perceptions and experiences
- CTQ: focus is on specific quality attribute(s) important to customers
Scope:
- KPI: broad, covers various aspects of business performance
- VOC: specifically addresses customer feedback and expectations
- CTQ: narrow focus on critical quality characteristics
Origin:
- KPI: typically set by management, based on business strategy
- VOC: comes directly from the customer
- CTQ: derived from customer requirements but defined by the organization
Usage:
- KPI: used for tracking overall business progress
- VOC: used for understanding customer needs and improving customer experience
- CTQ: used for quality control and process improvement
Measurement:
- KPI: always quantitative
- VOC: may be both qualitative and quantitative
- CTQ: typically quantitative, but may have qualitative aspects
In summary, a KPI measures overall business performance, the VOC captures customer feedback and expectations, and CTQs define specific quality attributes critical to meeting customer needs. Together, these concepts provide a comprehensive framework for managing business performance, customer satisfaction, and product/service quality.
Key Activities
- Data Collection Plan: Establish what data needs to be collected, how they will be collected, and who will collect them. A data collection plan is a crucial component of the Measure phase. Below is an example of a commonly used DMAIC data collection plan along with a data collection template:
Example of DMAIC Data Collection Plan
Purpose: To gather accurate and relevant data to analyze the current process performance and identify improvement opportunities.
Steps:
- Define the problem and process to be measured
- Identify the critical-to-quality (CTQ) measure
Examples of CTQ
On-time Delivery: At a logistics company, a CTQ measure could be the on-time delivery rate. Customers expect their packages to be delivered within the promised time frame. Therefore, the percentage of deliveries that meet the promised delivery date is a critical measure of quality.
Defect Rate: In a manufacturing process, a CTQ could be the defect rate of the produced items. Customers expect the products they purchase to be free of defects. Therefore, the percentage of products that have defects is a critical measure of quality.
- Determine the data types needed ( or )
- Specify the data collection method
- Determine the sample size and frequency
Comparison
| Feature | Discrete Data | Continuous Data |
|---|---|---|
| Definition | Whole numbers, specific values, no in-between | Can take any value within a range, includes fractions/decimals |
| How It’s Measured | Counting | Measuring |
| Examples | Number of defective products, customer complaints, employees in a company | Product weight, temperature, time to complete a task |
| Graph Type | Bar Chart | Histogram, Line Graph |
Examples:
- Discrete: You count how many customers visit a store (e.g., 10, 15, 20 customers). You can’t have 10.5 customers.
- Continuous: You measure how long customers wait in line (e.g., 2.3 minutes, 5.8 minutes). Time can have decimal values.
In Lean Six Sigma, knowing the difference helps in choosing the right data analysis tools!
Determining the sample size and frequency in the Measure phase of a Six Sigma project involves statistical analysis and practical considerations. Below is a general approach:
- Sample Size: The sample size depends on the level of confidence and precision you want in your results. A larger sample size will give you more confidence in your results and a smaller margin of error. You can use statistical formulas to calculate the sample size; below is a simple random sample from a large population using the following formula in Excel:
=ROUNDUP((Z^2 * P * (1-P)) / E^2, 0)
where Z = Z-score corresponds to the desired confidence level. Common values for Z are
- 1.645 for 90% confidence level
- 1.96 for 95% confidence level
- 2.58 for 99% confidence level
and P = Expected proportion (if unknown, use 0.5 for maximum sample size); E = Desired margin of error (as a decimal). For example, a 5% margin of error uses 0.05.
For easier use, set up a spreadsheet with cells for Z, P, and E, and then reference these cells in the formula. This allows for easy adjustment of these parameters and to observe how they affect the required sample size.
- Sample Frequency: The frequency of sampling often depends on the process variation and the practical constraints of the process. If the process is stable and does not change much over time, you may sample less frequently. Conversely, if the process is highly variable, more frequent sampling is better. Practical considerations include the cost of sampling and the time required to process samples.
Remember, these are general guidelines. The specifics will depend on the nature of your project, the characteristics to be measured, and the statistical analysis. Consulting with a statistician or using statistical software may help to determine the appropriate sample size and frequency. Always ensure that the sampling method is random and represents the process or population studied, as to avoid bias.
- Assign responsibilities for data collection
- Create a data collection form/template
- Train team members on data collection procedures
- Implement the data collection process
- Verify data accuracy and completeness
Example Scenario, Sampling
A manufacturing company wants to reduce defects in its product assembly process.
| Date | Shift | Operator | Product Model | Units Produced | Defects Found | Defect | Type | Comments |
How to Use the Data Collection Template:
- Date: Enter the date of collection (MM/DD/YYYY)
- Shift: Indicate work shift (e.g., morning, afternoon, night)
- Operator: Enter name/ID of the operator
- Product Model: Specify model being assembled
- Units Produced: Total number of units produced during the shift
- Defects Found: Enter the number of defective units
- Defect Type: Categorize defect, e.g., missing part, misalignment, faulty connection
- Comments: Any relevant observations or additional information
Data Collection Guidelines:
- Collect data for each shift over a period of 30 days
- Ensure all fields are completed accurately
- Report any unusual circumstances that may affect data
- Submit completed forms to the quality control supervisor at the end of each shift
By using this data collection plan and template, the manufacturing company can gather structured and consistent data to analyze its assembly process, identify patterns in defects, and develop targeted improvement strategies. This approach aligns with the DMAIC methodology, as it provides a solid foundation for the subsequent Analyze, Improve, and Control phases of the project.
Tools and Techniques
- Baseline Measurement: Measures current process performance to establish a baseline
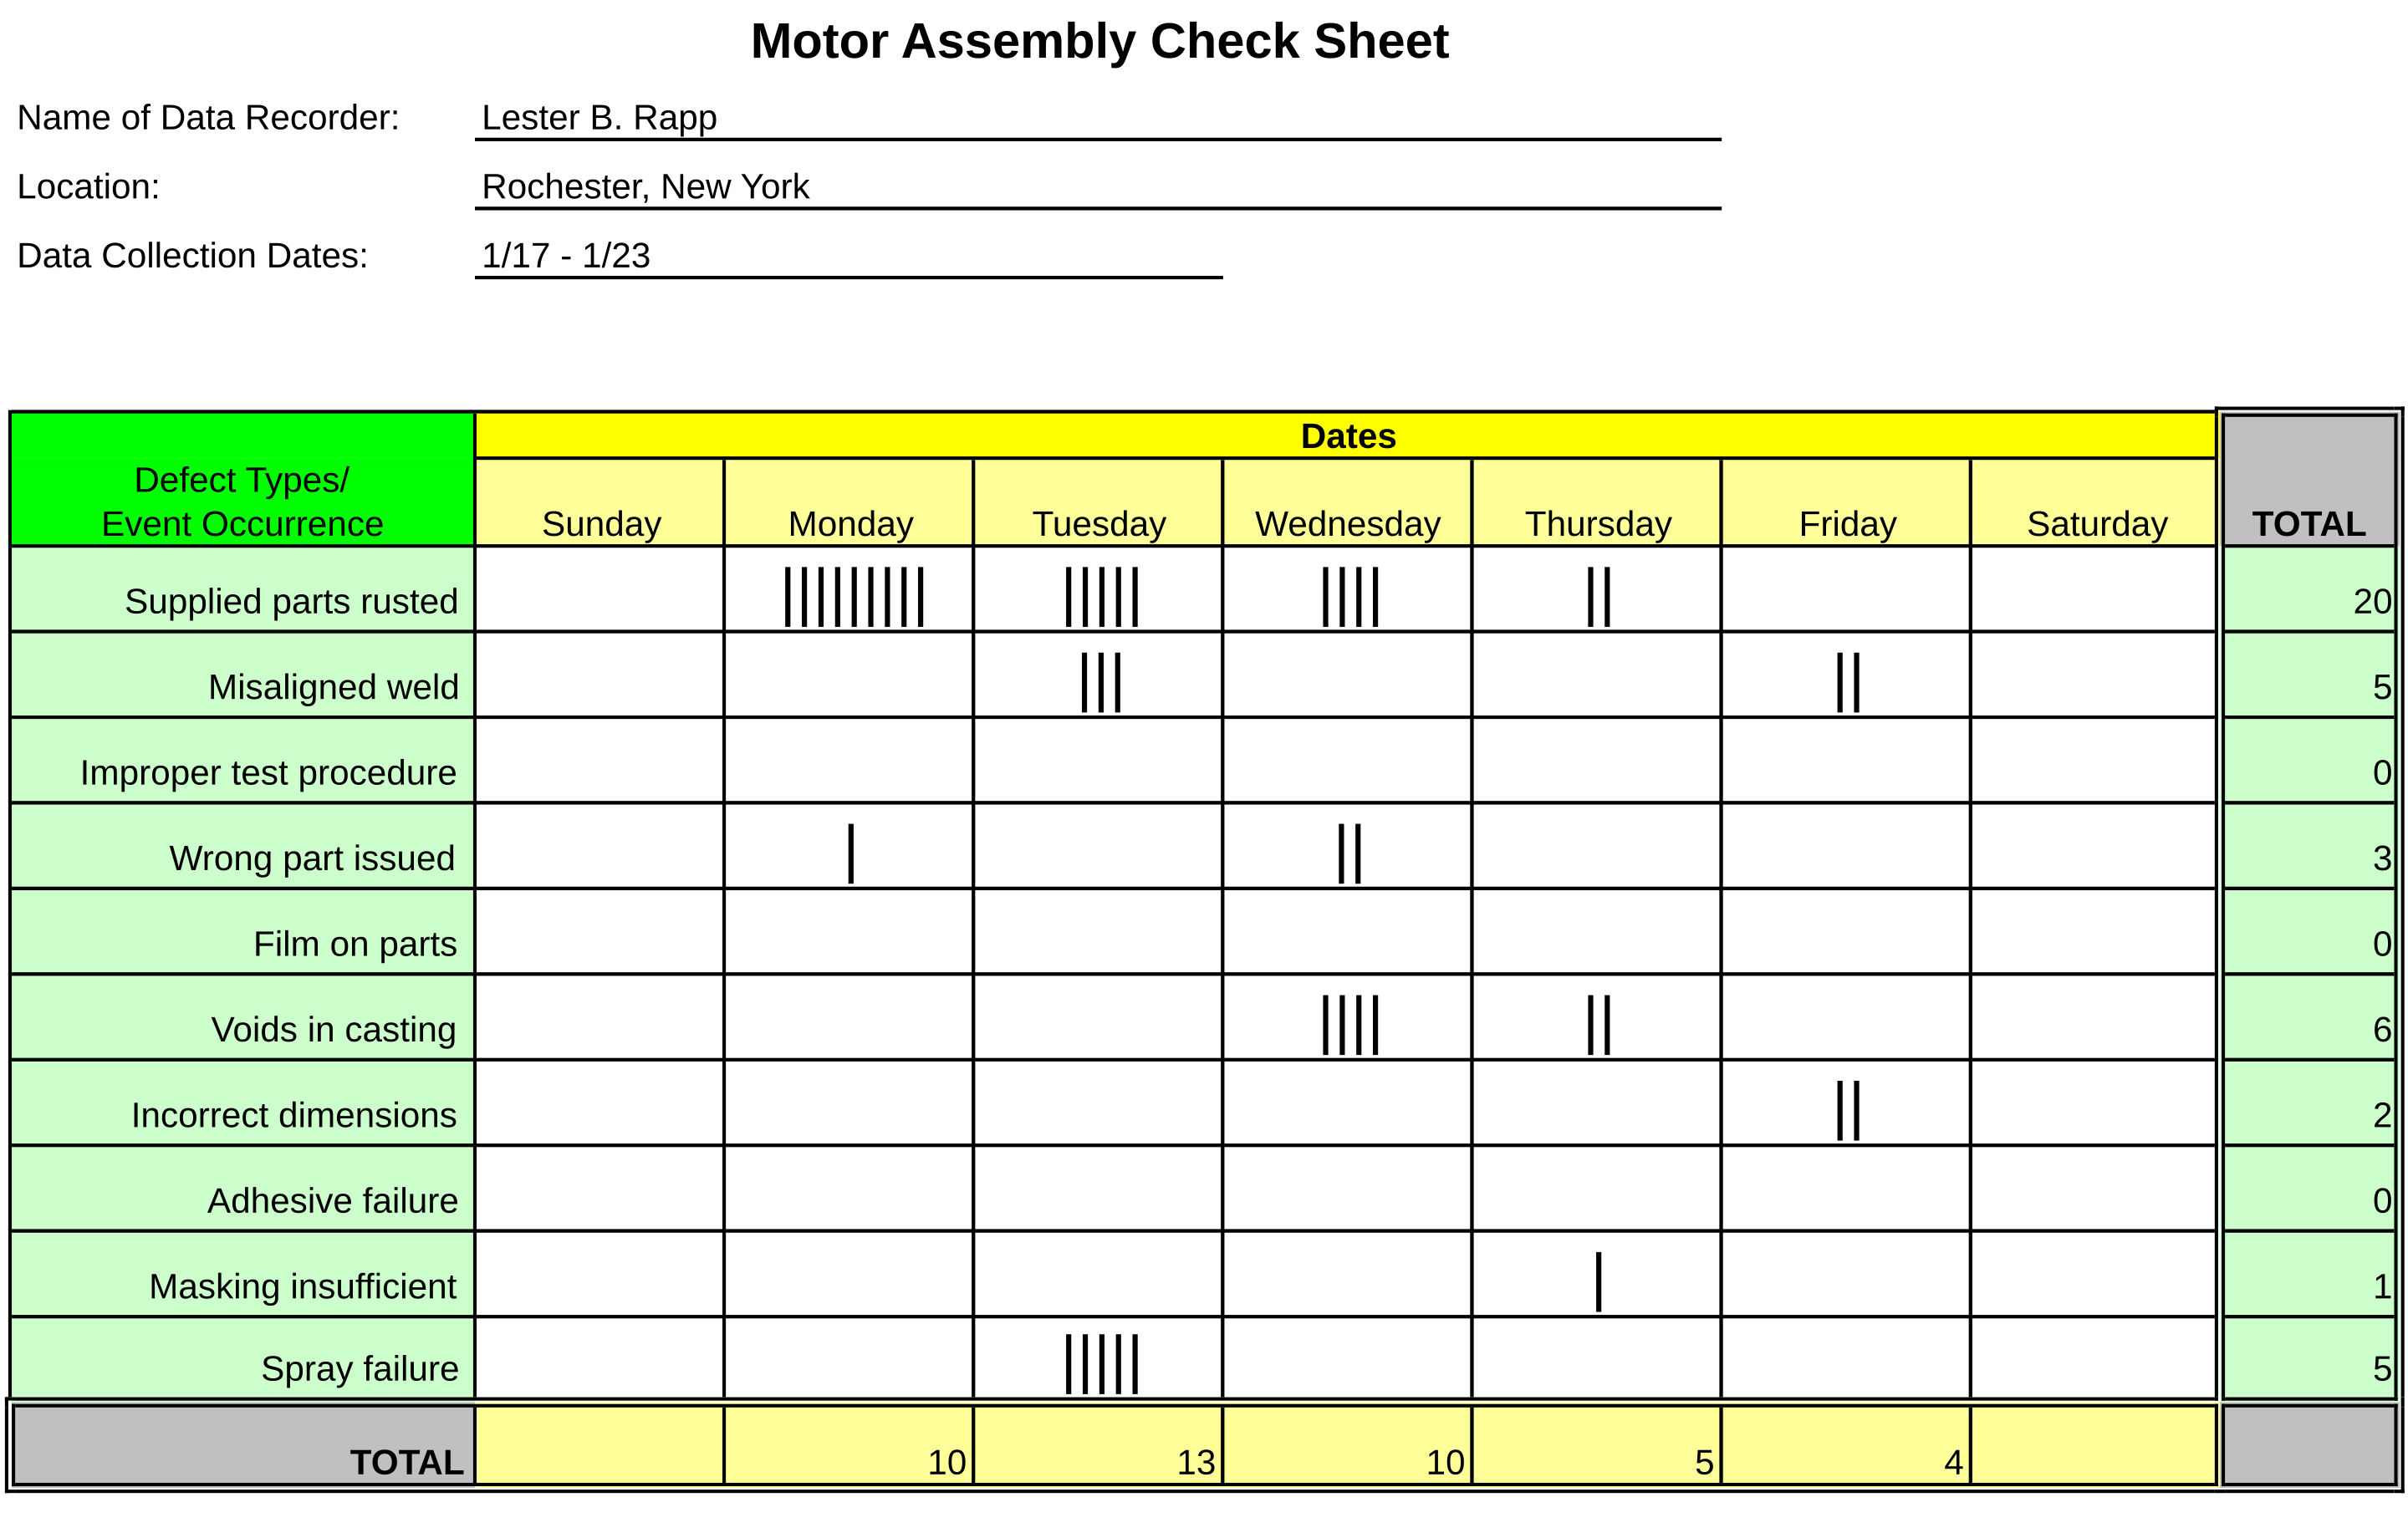
- Check Sheets: Used to collect data in a structured manner
- : Helps to identify the most significant factors in a dataset
- Process Flowcharts: Visually represents of the process steps to identify potential areas of improvement
- Process Mapping: Detailed mapping of the current process to identify key inputs and outputs
Example
The manufacturing company collects data on its production line’s defect rate over the past six months. It uses check sheets to gather data and creates s to identify the most common types of defects.
Analyze
Purpose of the Analyze Phase
The third phase of the DMAIC process involves analyzing the data collected in the Measure phase. It centers on determining the root cause of the problem as well as sources of variation and defects. Various data analysis tools are useful in this phase to understand the cause-and-effect relationships in the process.
Data Analysis Tools and Techniques
- Root Cause Analysis: Identifying the underlying causes of defects or performance issues
- Fishbone Diagram (Ishikawa): Identifying root causes by categorizing potential sources of a problem
- Five Whys Analysis: Asking “Why?” repeatedly to drill down to the root cause of a problem
- Hypothesis Testing: Testing assumptions about potential causes of an issue to determine their validity
- Process Analysis: Examining the process flow to identify bottlenecks or inefficiencies
- Regression Analysis: Statistical method to identify relationships among variables
Example – Data Analysis, Both Quantitative and Qualitative
The team uses a Fishbone Diagram to brainstorm potential causes of defects and conducts a Five Whys Analysis to pinpoint root causes. They perform regression analysis to understand the relationship between production speed and defect rate.
Improve
Purpose of the Improve Phase
Once the root cause has been identified, the Improve phase involves generating, selecting, and implementing solutions that address it. This phase concerns making necessary changes to the process to reduce variation and improve its performance.
Key Activities
- Generating Solutions: Brainstorm and select potential solutions.
- Pilot Testing: Implement solutions on a small scale to test their effectiveness.
- Implementation Plan: Develop a detailed plan for full-scale implementation.
Tools and Techniques in the Improve Phase
- Brainstorming: Generate a wide range of ideas as potential solutions.
- Design of Experiments (DOE): Plan experiments to test multiple variables simultaneously.
- Kaizen Events: Set up focused, short-term projects to improve specific areas of the process.
Example
The team brainstorms several solutions, including adjusting the production speed and improving worker training. They conduct a pilot test of these solutions and use DOE to determine the optimal production settings. Successful solutions are then implemented across the entire production line.
In the DMAIC framework, the Design of Experiments (DOE) technique is typically used during the Improve phase. This phase focuses on developing and testing solutions to address root causes identified in the Analyze phase. DOE is a structured, systematic method for determining the relationship among factors affecting a process and the output of that process. It helps to identify the best combination of variables to achieve optimal performance.
Control
Purpose of the Control Phase
The final phase of the DMAIC process is Control. In it, the improved process is controlled and monitored to ensure that it continues to work as expected and that any deviations are corrected before they result in defects. This phase involves creating a control plan and continuously monitoring the process to sustain improvements using control mechanisms. The Control phase ensures that the improvements from the Improve phase are sustained over time.
Key Activities
- Control Plan: Develop a plan to monitor and control the improved process.
- Standard Operating Procedures (SOPs): Document new procedures to standardize the improved process.
- Training: Train employees on the new procedures and controls.
Tools and Techniques
- Control Charts: Use to monitor process stability and variation over time (see Chapter 7 for more details).
- Mistake Proofing (Poka-yoke): Implement fail-safes to prevent errors.
- Documentation: Create detailed documentation of the new process and controls.
Example
A manufacturing company develops a control plan that includes regular monitoring of defect rates using control charts. It updates its SOPs to reflect the new process improvements and train employees on the changes. Mistake-proofing techniques are implemented to prevent common errors.
Each phase of the DMAIC process plays a crucial role in problem solving and process improvement. By following these steps, organizations can systematically identify and eliminate waste, reduce process variability, improve customer satisfaction, and achieve operational excellence. Remember, the key to successful DMAIC implementation is to spend sufficient time on each phase.
Comparing PDCA (Total Quality) and DMAIC (Six Sigma)
The PDCA (Plan-Do-Check-Act) cycle is an iterative, four-step problem-solving technique for improving business processes. On the other hand, DMAIC (Define-Measure-Analyze-Improve-Control) is a data-driven improvement cycle used in Six Sigma projects. To map PDCA steps into DMAIC phases, see below:
- Plan (PDCA): This corresponds to the Define and part of the Measure phase in DMAIC. In this step, identify a problem, develop a problem statement, set the project goal, and gather data on the current process.
- Do (PDCA): This aligns with the rest of the Measure and the Analyze phase in DMAIC. Implement the plan on a small scale, collect data for inspection, and identify the root cause of the problem.
- Check (PDCA): This maps to the Improve phase in DMAIC. Analyze the data collected during the Do phase and compare the results against the expected outcomes to ascertain any differences. Develop, test, and implement solutions to the problem.
- Act (PDCA): This corresponds to the Control phase in DMAIC. If the solution is successful, standardize the solution to the problem and implement it on a wider scale. Also, monitor the process to ensure that improvements are sustained over time.
PDCA and DMAIC are complementary methodologies. They can be very effective when used together. PDCA provides a simple and iterative approach for continuous improvement, and DMAIC provides a structured framework for problem-solving and process improvement. Both methodologies aim to drive continuous improvement and eliminate waste.
Comparing the A3 (Lean/Toyota Production System) to DMAIC (Six Sigma):
- Define: This phase corresponds to the Background and Current Conditions areas of the A3 form. The corresponding steps are to identify the problem, establish the project goal, and define the process that needs improvement.
- Measure: This phase aligns with the Goal and Analysis areas of the A3 form. The steps are to quantify the problem and establish a baseline for future comparison. Also, the root cause of the problem may become apparent at this point.
- Analyze: This phase is represented by the Root Cause Analysis area of the A3 form. Identify the cause(s) of the problem using data and process analysis techniques.
- Improve: This phase maps to the Countermeasures area of the A3 form. Develop, test, and implement solutions. Also, evaluate the results based on the measures identified in the Measure phase.
- Control: This phase corresponds to the Follow-up Actions and Future Plans sections of the A3 form. Monitor the process to ensure that improvements are sustained over time. Also, document lessons learned and plan the next steps for problem prevention.
Although there is a clear correspondence, A3 and DMAIC are not identical. They are complementary tools from different methodologies, and they can be very effective when used together. The A3 form provides a simple and concise way to document the problem-solving process, while DMAIC provides a structured approach to project management. Essentially, both aim to drive continuous improvement and eliminate waste.
Using DMAIC for Operational Excellence
Integration into Business Strategy
DMAIC should be integrated into an organization’s overall business strategy to drive operational excellence. This integration involves aligning DMAIC projects with strategic objectives and ensuring that top management supports such initiatives.
Continuous Improvement Culture
A culture of continuous improvement is crucial for sustaining the benefits of DMAIC. This includes encouraging employee involvement, ongoing training, and recognizing employees’ improvement efforts.
Performance Measurement
Regularly measuring and reviewing performance metrics helps to identify new improvement opportunities, and it ensures that gains are maintained.
Case Study
A service organization uses DMAIC to reduce customer wait times. By following the DMAIC phases, it identifies root causes, implements process changes, and establishes controls to maintain the improvements. As a result, customer satisfaction scores increase, and operational efficiency improves.
Summary
The DMAIC methodology is a powerful framework for solving problems and driving operational excellence. By systematically progressing through the Define, Measure, Analyze, Improve, and Control phases, organizations can identify the root causes of their issues, implement effective solutions, and sustain improvements. Integrating DMAIC into the organizational culture and strategy further enhances its impact, and this leads to continuous improvement and long-term success. By mastering each phase, practitioners have the tools to effectively tackle complex problems and achieve sustainable improvements in their organizations.
References, Chapter 6
- George, M. L., Rowlands, D., Price, M., & Maxey, J. (2005). The Lean Six Sigma Pocket Toolbook: A quick reference guide to 100 tools for improving quality and speed. McGraw-Hill.
- Pande, P. S., Neuman, R. P., & Cavanagh, R. R. (2000). The Six Sigma Way: How GE, Motorola, and other top companies are honing their performance. McGraw-Hill.
- Breyfogle, F. W. (2003). Implementing Six Sigma: Smarter solutions using statistical methods. Wiley.
- Harry, M. J., & Schroeder, R. (2000). Six Sigma: The breakthrough management strategy revolutionizing the world’s top corporations. Doubleday.
- Gitlow, H. S., Levine, D. M., & Popovich, E. (2005). Six Sigma for Green Belts and Champions: Foundations, DMAIC, tools, cases, and certification. Prentice Hall.
References, Supporting DOE in the Improve Phase
- Montgomery, D. C. (2012). Design and Analysis of Experiments. John Wiley & Sons.
This book provides a comprehensive overview of DOE techniques and their applications in process improvement.
- George, M. L., Rowlands, D., Price, M., & Maxey, J. (2005). The Lean Six Sigma Pocket Tool Book: A quick reference guide to 100 tools for improving quality and speed. McGraw-Hill.
This resource includes practical guidance on using DOE within the DMAIC framework.
- Breyfogle, F. W. (2003). Implementing Six Sigma: Smarter solutions using statistical methods. Wiley.
This book covers advanced statistical methods, including DOE, for implementing Six Sigma improvements.
Appendix, Chapter 6
Pareto Chart
A is a bar graph combined with a cumulative line graph that helps identify the most significant factors contributing to a problem. It is based on the (80/20 rule), which states that roughly 80% of problems stem from 20% of causes. The objective is to separate the vital few from the trivial many.
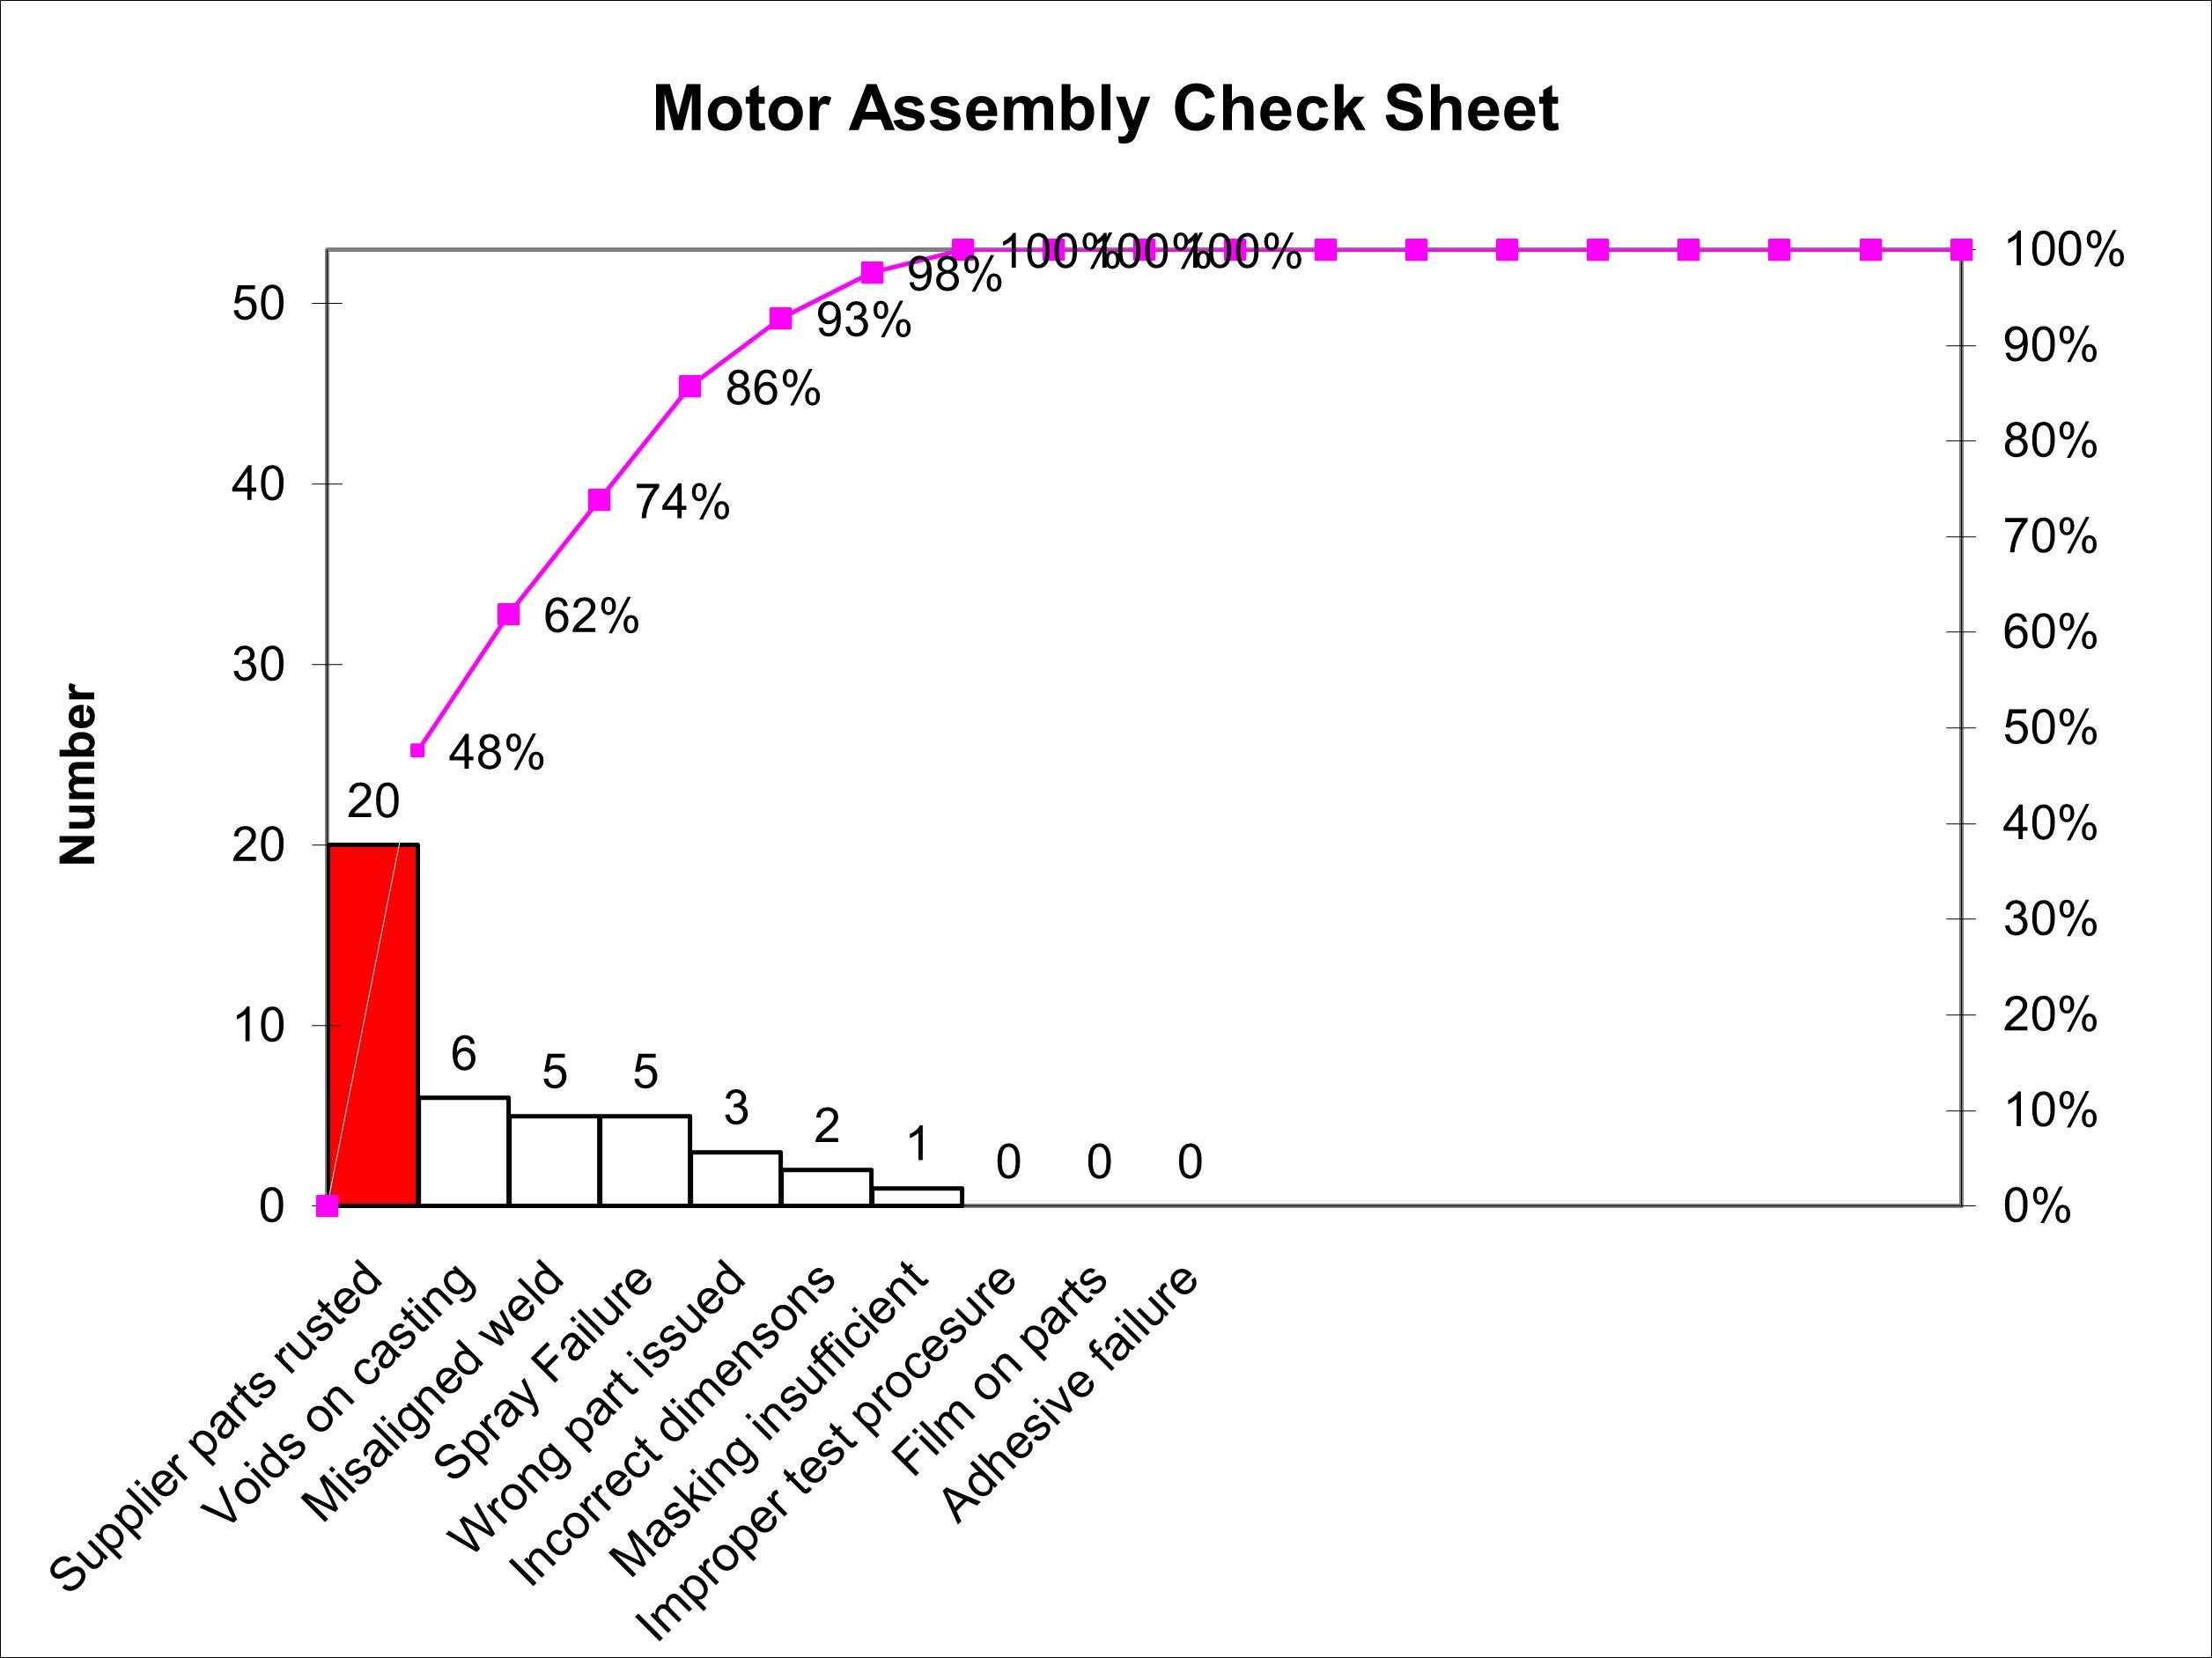
Construction of a Pareto Chart:
- Identify Categories – Collect data on different problem causes or defect types. (See Check Sheet below)
- Sort by Frequency or Impact – Arrange the categories in descending order based on frequency, cost, or other impact measures.
- Create a Bar Chart – Plot the categories on the x-axis and their frequencies on the y-axis.
- Add a Cumulative Line – Plot the cumulative percentage of occurrences over the bars.
- Analyze the Chart – Identify the most critical few factors contributing to the majority of the issue.
Value in Lean Six Sigma:
- Prioritization: Focuses improvement efforts on the most impactful problems.
- Data-Driven Decision Making: Provides visual clarity on defect distribution.
- Efficiency Gains: Helps allocate resources effectively for maximum impact.
- Continuous Improvement: Supports root cause analysis and problem-solving in Lean Six Sigma projects.
By using Pareto charts, organizations can systematically address the most significant defects or inefficiencies, leading to higher quality, reduced waste, and improved operational performance.
VOC
To effectively deconstruct the Voice of the Customer (VOC) into actionable information, organizations can follow a systematic methodology that goes beyond traditional methods like Net Promoter Score (NPS) surveys. Below is a detailed process to transform VOC data into practical steps.
Step-by-Step Process to Deconstruct VOC
- Capture VOC Data
Use Diverse Sources: Collect data from various channels, such as online reviews, customer surveys, support emails, call transcripts, social media interactions, and chat conversations. This diverse approach ensures a comprehensive understanding of customer sentiments and experiences.
- Prepare and Structure Data
Clean the Data: Transform raw data into a structured format suitable for analysis. For example, use speech analytics tools to convert call recordings into text and categorize feedback into manageable segments. This step often involves removing irrelevant information and standardizing formats.
Categorize: Organize feedback into themes or categories based on common issues or sentiments. This helps identify key areas of concern and/or satisfaction among customers.
- Analyze Data for Insights
Use Trend Analysis: Examine the structured data to identify trends, recurring themes, and significant patterns in customer feedback. Look for correlations among different data points, such as product features from positive reviews versus those from complaints.
Use Sentiment Analysis: Engage text analytics tools to assess customer sentiment (positive, negative, neutral) across various feedback sources. This can provide insight into overall customer satisfaction and highlight specific areas that need improvement.
- Prioritize Findings
Identify Focus Areas: Based on the analysis, prioritize the most pressing issues or opportunities to improve. Consider factors such as the frequency of mentions, the severity of complaints, and potential impact these may have on customer loyalty and revenue.
Involve All Stakeholders: Engage cross-functional teams early in the process to gather input on potential solutions. This collaborative approach fosters a sense of ownership and a commitment to addressing customer concerns.
- Develop Action Plans
Use Targeted Strategies: Create specific action plans to address the prioritized findings. These plans should include measurable goals tied to business objectives (e.g., improving customer satisfaction scores or reducing s) and an outline of steps needed to implement changes.
Allocate Resources: Identify the resources required for implementation. These may include personnel, technology, and budget considerations.
- Implement Changes
Execute: Roll out the action plans across relevant departments. Ensure that all team members are aware of their roles in executing these changes.
Communicate: Keep customers informed of improvements made based on their feedback. This transparency helps build trust and loyalty.
- Monitor and Iterate
Track Performance: Continuously monitor the effectiveness of the implemented changes through follow-up surveys and performance metrics. This ongoing assessment allows an organization to gauge success and make necessary adjustments.
Create a Feedback Loop: Establish a closed-loop system where customer feedback is regularly collected, analyzed, and integrated. This iterative process ensures that an organization remains responsive to evolving customer needs.
Conclusion
This structured approach to deconstructing VOC data can transform raw customer feedback into actionable insights for meaningful improvements in products, services, and overall customer experience. This methodology not only enhances customer satisfaction, but it also fosters a culture of continuous improvement within an organization.
Chapter Summary
- Video Source: YouTube.com, What is SIPOC & how to create a SIPOC diagram step-by-step, by RISR Careers, https://youtu.be/i_JcH1Y8Ka4?si=Z86CBoOOXV_Lyxsu (Accessed January 24, 2025). (24:29) ↵
(Voice of Customer) What customers want and need.
Example: Listening to what toppings friends want on pizza.
A metric that measures customer loyalty by asking how likely they are to recommend a product or service.
Example: Rating how likely you are to tell your friends about your favorite restaurant.
(Critical to Quality) The key features that make customers happy with a product or service.
Example: For a bicycle, having working brakes is critical to quality - it must be safe to ride.
(Internet of Things) A smart device that connects to the internet to share data.
Example: A thermostat that you can control with your phone.
(Enterprise Resource Planning) A computer system that helps manage all parts of a business.
Example: Like having one big digital notebook that keeps track of everything in your lemonade stand.
(Manufacturing Execution System) Computer system tracking production in real time.
Example: Like a scoreboard showing how many cookies each baker makes.
Measurable values that can take any number within a range.
Countable, distinct values with gaps between them.
A Pareto chart is a bar graph combined with a cumulative line graph that helps identify the most significant factors contributing to a problem. It is based on the Pareto Principle (80/20 rule), which states that roughly 80% of problems stem from 20% of causes. The objective is to separate the vital few from the trivial many.
The idea that 80% of results come from 20% of efforts.
Example: Realizing that most of your study success comes from focusing on a few key subjects.
Churn Rate: The percentage of customers who stop using a product or service in a given period.
Example: A software company loses 20 out of 100 subscribers in a month, resulting in a 20% monthly churn rate.
