PART 2: METHODOLOGIES, PRINCIPLES AND TOOLS
7 Chapter 7: Six Sigma Principles and Tools
Learning Objectives
- Understand the core principles and concepts of Six Sigma.
- Use Six Sigma tools, including SPC, process capability analysis, hypothesis testing, and Design Of Experiment (DOE).
- Evaluate Six Sigma’s role achieving operational excellence.
Learning Outcome:
Use and evaluate Six Sigma principles and tools to achieve operational excellence.
Topics:
- The DMAIC problem-solving approach
- Statistical Process Control (SPC), process capability analysis, hypothesis testing, and Design of Experiment (DOE).
- Achieving operational excellence through Six Sigma
The Core Principles and Concepts of Six Sigma in Simple Terms
You’re selling lemonade. You want to make sure every cup of lemonade you sell tastes just right – not too sour and not too sweet. Six Sigma is a way to help you make sure that this happens every single time.
Six Sigma’s Core Principles:
- Customer Focus: Always think about what your customers want. If they like their lemonade a certain way, make sure to keep it that way.
- Understanding the Process: Know all the steps to make lemonade – squeezing lemons, adding sugar, and mixing water. By understanding each step, it is easy to see at what point things might go wrong.
- Data and Measurement: Measure how much lemon juice, sugar, and water used each time. This helps to observe if something has varied from your perfect lemonade recipe.
- Identifying Problems: If a batch of lemonade is too sour, look at the measurements and steps to find out what went wrong. It may be due to too much lemon juice or not enough sugar.
- Fixing Problems: Once you find the problem, figure out how to fix it so that it does not happen again. Perhaps create a rule to always use the same amount of sugar each time.
- Consistency: Every cup of lemonade that you make should taste the same. This means you must follow the same steps and measurements every time.
- Improvement: Continuously look for ways to make your lemonade better. For example, you may find a way to mix it faster or keep it colder on hot days.
Six Sigma is a recipe book for ensuring that everything you do is the best it can be, every single time you do it.
What Is Hypothesis Testing?
Hypothesis testing in Lean Six Sigma is a way to check your guesses or assumptions about a problem using actual data. Think PDCA: Plan is the phase in which the hypothesis is formed.
Why is Hypothesis Testing Useful?
Hypothesis testing is useful because it aids in making data-driven decisions, rather than making decisions based on guesses or assumptions. It confirms whether or not a change that was made actually improved the process in question.
Example of the Hypothesis Testing Technique
Imagine you are trying to reduce your weight. Your hypothesis is that if you reduce your caloric intake by 500 calories each day, your weight will go down.
Steps in Hypothesis Testing:
- Formulate the Hypothesis:
- Null Hypothesis (H0): Reducing calories by 500 does not reduce my weight.
- Alternative Hypothesis (H1): Reducing calories by 500 reduces my weight.
- Collect Data:
- Before beginning your experiment, record your weight for several weeks.
- After you begin your experiment, record your weight for the next several weeks.
- Analyze the Data:
- Compare weight before and after reducing calories.
- Use statistical methods to see if the difference in weight is significant (not due to chance).
- Make a Decision:
- If the analysis shows that your weight decreased significantly, you reject the null hypothesis and accept the alternative hypothesis.
- If the analysis shows that your weight did not decrease significantly, you fail to reject the null hypothesis.
Example Calculation:
- Before less calories: Weight = 125, 126, 124, 125
- After less calories: Weight = 120, 119, 118
Use a statistical test, such as a t-test, to compare the average weights from before and after. If the test shows a significant decrease in weight, it supports your hypothesis that reducing daily calorie intake by 500 helps you to reduce your weight.
Why Is This Useful?
- Decision Making: This helps to decide if this weight reduction strategy is an effective one.
- Confidence: You can be more confident that your weight loss is due to the reduced calories and not just a random occurrence.
- Efficiency: The test prevents you from wasting time on changes that are ineffective.
Lean Six Sigma uses hypothesis testing to verify improvements in processes, such as checking if a new way of assembling products in a factory reduces defects or determining if a new teaching method at a school actually improves student performance.
PDCA Cycle and Hypothesis Testing in Healthcare
A hospital system wants to reduce patient wait times in its Emergency Department (ED). Hypothesis testing maps to the PDCA cycle in this context as follows:
- Plan:
- Define the Hypothesis: Identify the problem and form hypotheses.
- Null Hypothesis (H0): Implementing a new triage system does not reduce patient wait times.
- Alternative Hypothesis (H1): Implementing a new triage system reduces patient wait times.
Example: The hospital hypothesizes that a new triage system, where nurses quickly assess patients’ conditions upon arrival, will reduce wait times.
- Do:
- Collect Data: Implement the change on a small scale and collect data.
- Experiment: Introduce the new triage system in a pilot program within the ED and record patient wait times.
Example: The hospital system runs the new triage system in one ED for a month and records wait times for each patient.
- Check:
- Analyze the Data: Compare the data collected with the hypotheses to observe for a significant effect.
- Statistical Test: Use hypothesis testing to analyze the data (e.g., a t-test) to determine if the new triage system significantly reduces wait times.
Example: Compare the average wait times before and after implementing the new triage system. Use statistical analysis to see if the new system significantly reduces wait times.
- Act:
- Decide and Implement: Based on the analysis, decide whether to adopt, modify, or discard the change.
- If the Null Hypothesis is Rejected: Implement the new triage system throughout all of the EDs in the hospital system.
- If the Null Hypothesis is Not Rejected: Consider other changes or modifications.
Example: If the analysis shows a significant reduction in wait times, the hospital decides to implement the new triage system throughout all of its EDs. If no significant change occurs, the hospital seeks other methods to reduce wait times.
Example of Summary Mapping
- Plan: The hospital system plans to test if a new triage system reduces ED wait times (hypothesis formation).
- Do: The hospital system implements the new triage system in a pilot program and collects patient wait time data (data collection).
- Check: The hospital system analyzes the data to see if there is a significant reduction in wait times (data analysis with hypothesis testing).
- Act: Based on the results, the hospital system decides to adopt, modify, or discard the new triage system (decision and implementation).
By aligning hypothesis testing with PDCA, the hospital system ensures that decisions to improve patient wait times are based on data, leading to continuous improvement in patient care.
Purposes of Design of Experiments (DOE) in the Improve Phase
The purposes of DOE in the Improve phase include the following:
- Identify the critical factors and the manner in which they interact to influence the output.
- Optimize the process parameters to achieve desired outcomes.
- Validate improvements by statistically testing various aspects.
Key Activities Involving DOE
- Identifying Factors and Levels: Select the variables (factors) and their possible values (levels) to be tested.
- Designing the Experiment: Plan the experiment layout, such as full factorial, fractional factorial, or Taguchi designs, depending on the number of factors and/or levels.
- Conducting the Experiment: Run the experiment according to the designed layout.
- Analyzing the Results: Use statistical methods to interpret results and determine the optimal settings for the factors.
Example of DOE
Consider a manufacturing company facing issues with the strength of a plastic component. The team has identified several factors that may be influencing its strength, such as temperature, pressure, and cooling time.
Step-by-Step DOE Implementation
- Identify Factors and Levels:
| Factor | Level | Level | Level |
|---|---|---|---|
| Temperature: | 200°C | 220°C | 240°C |
| Pressure: | 500 psi | 600 psi | |
| Cooling Time: | 30 seconds | 60 seconds |
- Design the Experiment:
A full-factorial design is chosen to test all combinations of the factors. This results in 3 (temperatures) x 2 (pressures) x 2 (cooling times) = 12 experimental runs.
- Conduct the Experiment:
The team conducts 12 experiments, each with a different combination of temperature, pressure, and cooling time, and they measure the strength of the plastic component in each case.
- Analyze the Results:
Statistical analysis (such as ANOVA) is performed to determine the factors that significantly affect the strength and to identify the optimal combination of factors. The results might show that the optimal settings for maximum strength are 220°C for temperature, 600 psi for pressure, and 60 seconds for cooling time.
Conclusion
In the Improve phase of the DMAIC framework, DOE is a powerful tool for optimizing processes and achieving significant improvements. By systematically exploring the relationships among multiple factors and the output, teams can identify the best conditions for process performance, enhancing quality and efficiency.
Statistical Process Control Chart (or Process Behavior Chart)
Within the DMAIC (Define, Measure, Analyze, Improve, Control) methodology of Six Sigma, several types of control charts are common. A quick and simple approach is to enter the data into an Excel spreadsheet and use the Chart Wizard in QI Macros (see Appendix for a 180-day license).
Based on search results and Six Sigma general knowledge, the most commonly used control charts are as follows:
- Variable (Continuous) Control Charts:
- X-bar and R Charts: Used for continuous data collected in subgroups at set time periods
- X-bar and S Charts: Used when subgroups have large sample sizes
- Individual and Moving Range (I-MR) Charts: Used for continuous data not collected in subgroups
- EWMA (Exponentially Weighted Moving Average) Charts: Used to monitor variables that consider the entire history of a given output
- Attribute (Discrete) Control Charts:
- p Charts: Used for fraction defective when sample size varies
- np Charts: Used for number of defectives when sample size is fixed
- c Charts: Used for number of defects when sample size is fixed
- u Charts: Used for number of defects per unit when sample size varies
Control charts are used at various stages of the DMAIC process, particularly in the Measure, Analyze, and Control phases. They establish baselines, identify sources of variation, and monitor process stability over time.
The selection of the appropriate control chart depends on several factors:
- The type of data being collected (continuous or discrete)
- If the data represent defects or defectives
- The sample size (fixed or variable)
- The specific process characteristics being monitored
By using these control charts, Six Sigma practitioners can effectively monitor processes, identify special cause variations, and ensure that improvements made during the DMAIC process are sustained in the long term.
The Control Chart Wizard in QI Macros also provides the correct selection of control chart based on the available data.
Consider a scenario monitoring the length of camshafts produced by a manufacturing machine. Collect data in subgroups of 5 samples each over 20 production runs.
X-bar and R Chart Example
Data Collection:
- Subgroup size (n) = 5 (5 samples are collected each time)
- Number of subgroups = 20 (over the course of the shift, 20 subgroups of 5 samples each are collected)
| Subgroup | Sample 1 | Sample 2 | Sample 3 | Sample 4 | Sample 5 | X-bar | Range |
|---|---|---|---|---|---|---|---|
| 1 | 100.2 | 100.5 | 100.3 | 100.1 | 100.4 | 100.3 | 0.4 |
| 2 | 100.3 | 100.2 | 100.4 | 100.3 | 100.1 | 100.26 | 0.3 |
| … | … | … | … | … | … | … | … |
| 20 | 100.4 | 100.3 | 100.2 | 100.5 | 100.3 | 100.34 | 0.3 |
Step 1: Calculate Control Limits
Using QI Macros, simply upload the data and open the Chart Wizard.
For this example, assume the following:
- Overall mean (X-double-bar) = 100.3 mm
- Average range (R-bar) = 0.35 mm
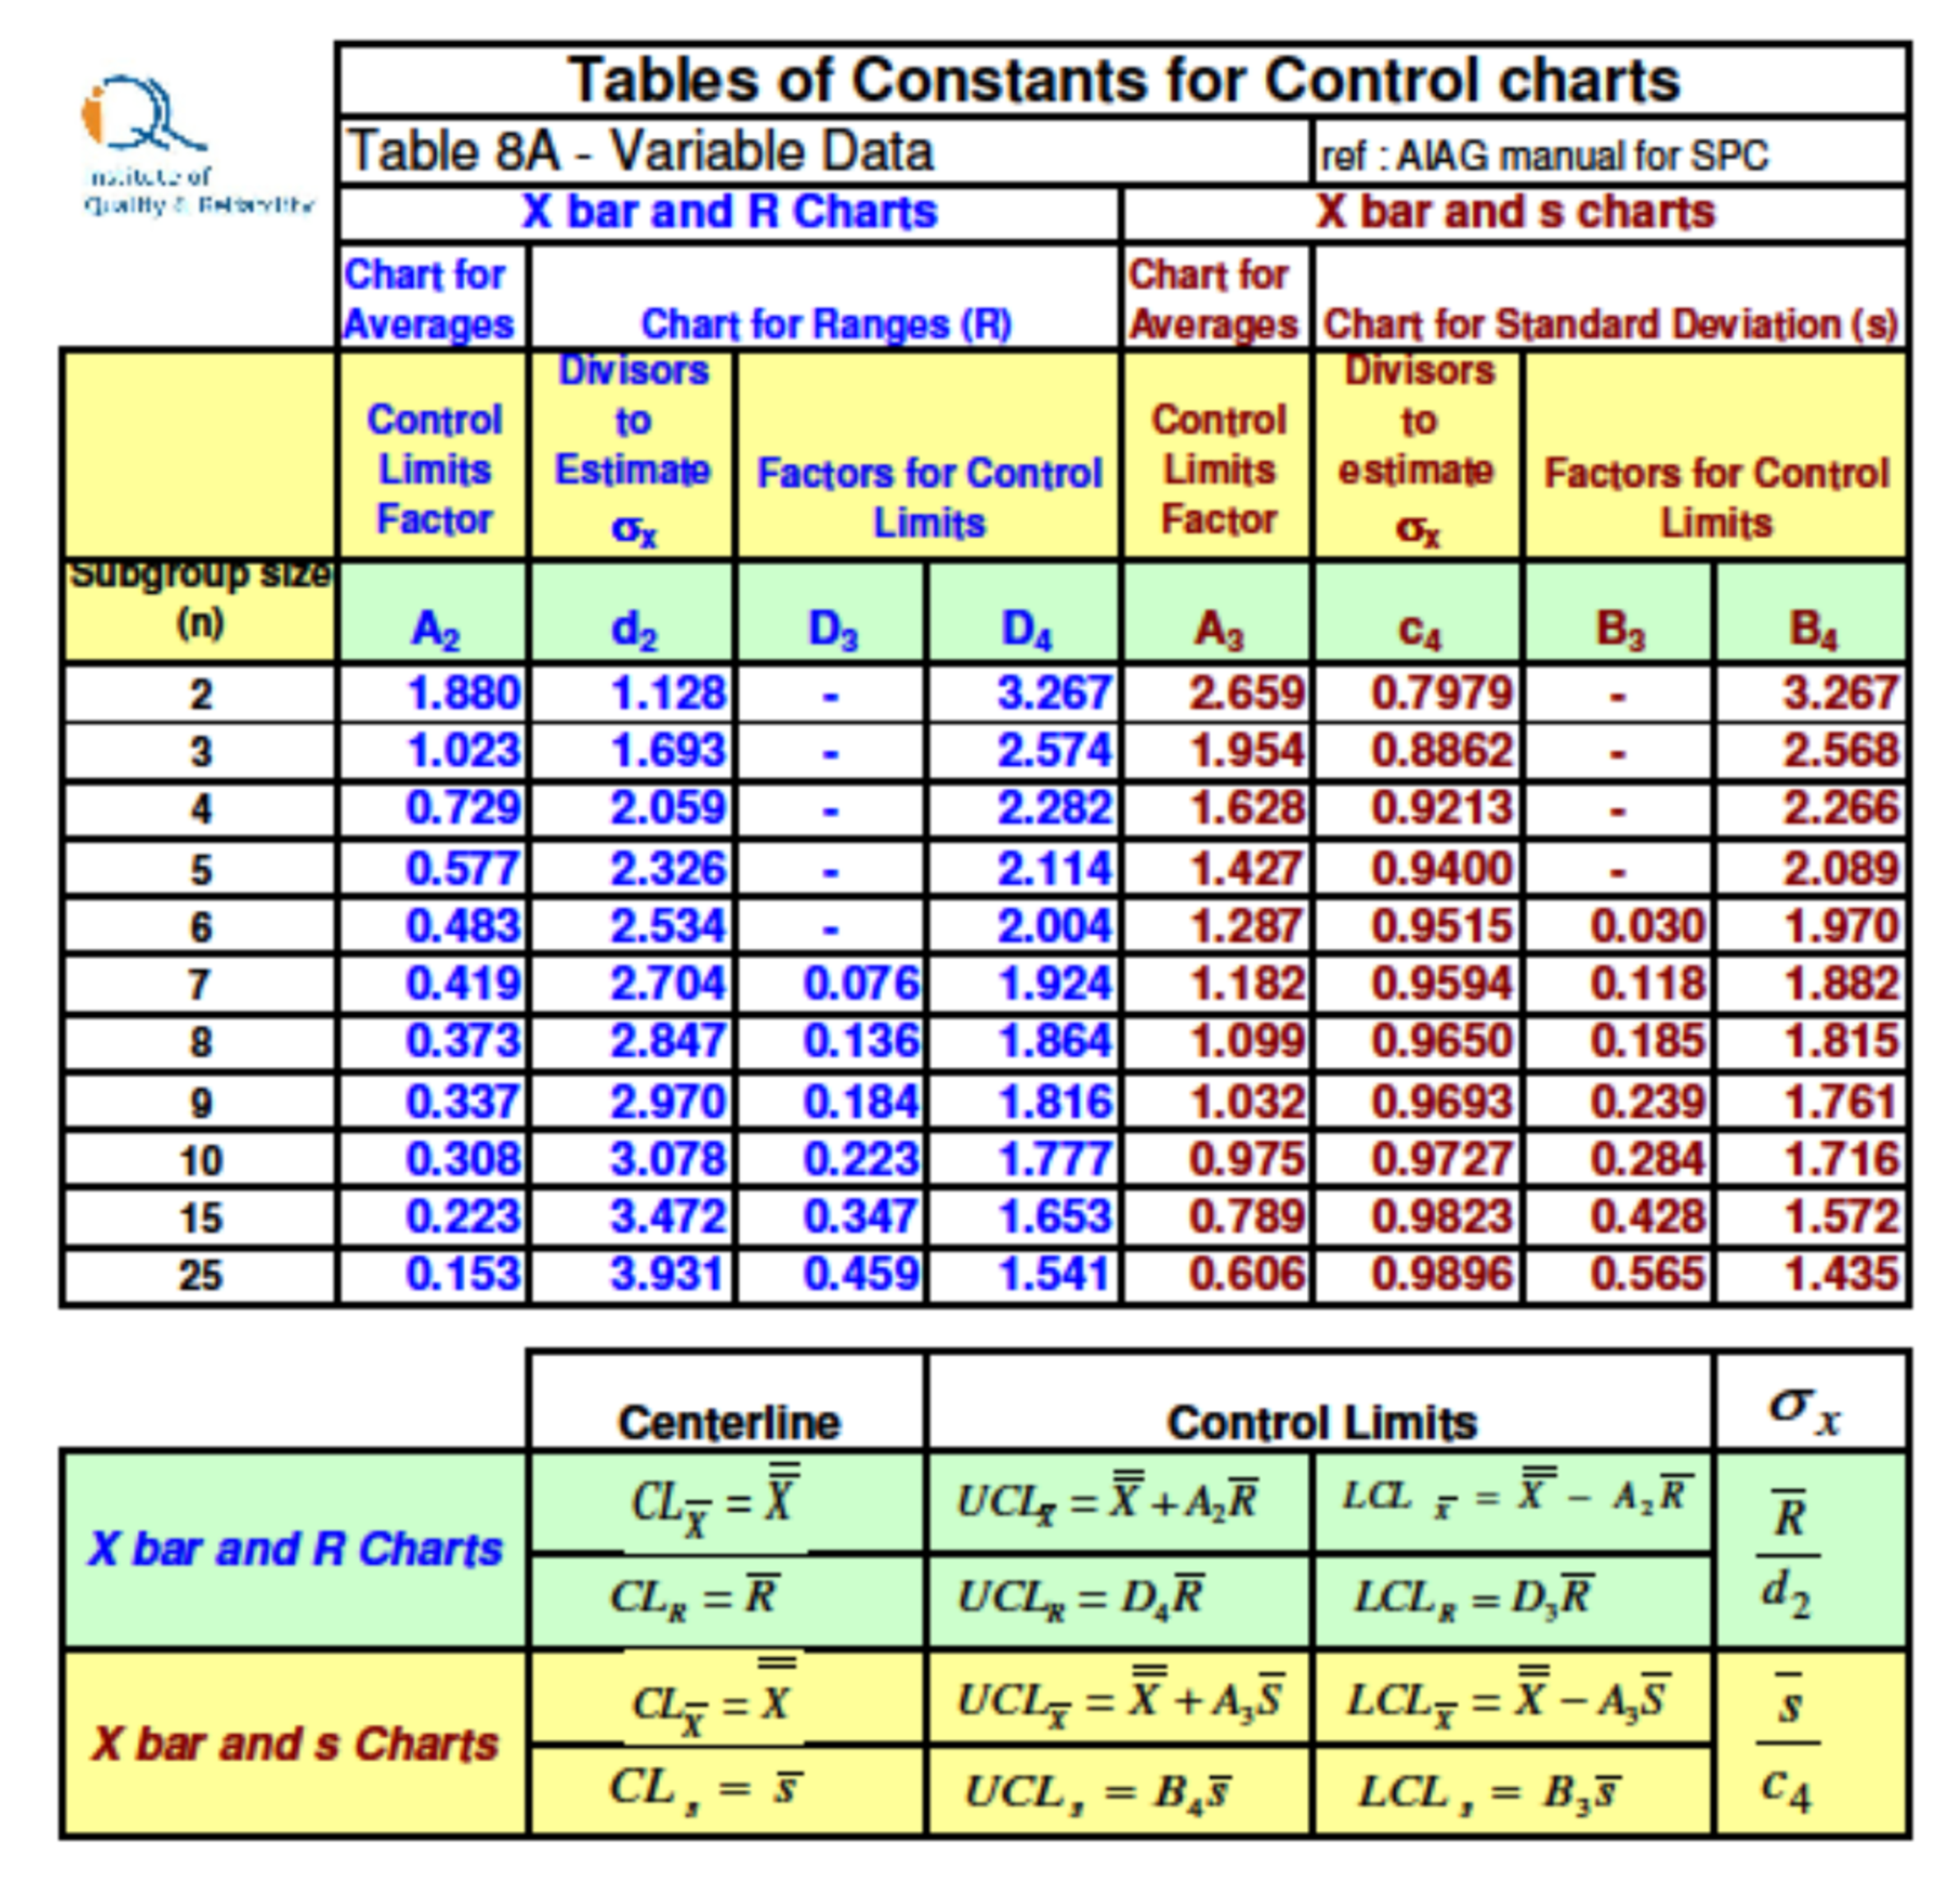
Using the constants for n = 5 from the control chart constants table:
- A2 = 0.577, D3 = 0, D4 = 2.114
X-bar Chart Control Limits:
- Upper Control Limit (UCL) = X-double-bar + A2 R-bar = 100.3 + 0.577 0.35 = 100.502 mm
- Center Line (CL) = X-double-bar = 100.3 mm
- Lower Control Limit (LCL) = X-double-bar – A2 R-bar = 100.3 – 0.577 0.35 = 100.098 mm
R Chart Control Limits:
- UCL = D4 R-bar = 2.114 0.35 = 0.740 mm
- CL = R-bar = 0.35 mm
- LCL = D3 R-bar = 0 0.35 = 0 mm
Step 2: Plot the Charts
Now plot both the X-bar and R charts:
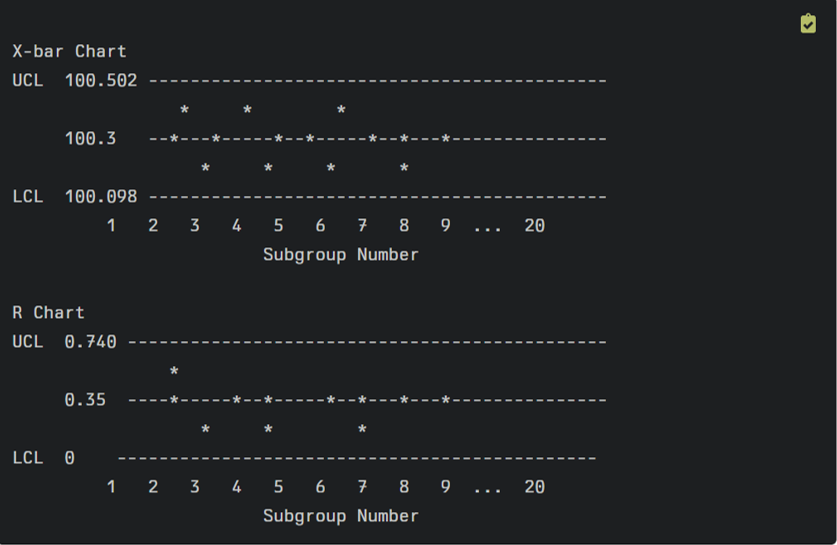
Step 3: Interpret the Charts
- R Chart: Examine this first. All points are within control limits and show no patterns, indicating that process variation is stable.
- X-bar Chart: Since the R chart is in control, interpret the X-bar chart. All points are within the control limits and show no concerning patterns. This suggests that the process average is stable.
Step 4: Process Capability
If the process is in statistical control (as it appears to be in this example), then proceed with process capability studies to determine if the process meets specification limits.
Process capability is a statistical measure of a process’s ability to produce output within specified limits. It quantifies how well a process is performing in relation to its specified tolerance limits. The most commonly used calculations to determine process capability are Cp, Cpk, Pp, and Ppk. Focus on Cp and Cpk, as they are the most widely used in Lean Six Sigma and the DMAIC methodology.
Cp (Process Capability Index)
The Cp index measures the potential capability of a process, assuming it is centered between the specification limits. It is calculated using the formula:
Cp = (USL – LSL) / (6σ)
where USL = the Upper Specification Limit, LSL = the Lower Specification Limit, and σ is the standard deviation of the process.
Interpretation of Cp
Cp > 1: The process has the potential to meet specifications, as the spread of the process is less than the spread of the specification limits.
Cp = 1: The process spread is equal to the specification spread.
Cp < 1: The process spread is greater than the specification spread, indicating that the process is not capable of meeting specifications consistently.
Cpk (Process Capability Index for Centered Process)
The Cpk index adjusts the Cp calculation to account for the process mean as off-center relative to the specification limits. It measures actual capability considering the mean, and it is calculated using the following formula:
Cpk = min((USL – μ) / (3σ), (μ – LSL) / (3σ))
where μ = the process mean, USL = the Upper Specification Limit, LSL = the Lower Specification Limit, and σ = the standard deviation of the process.
Interpretation of Cpk
Cpk>1.33 is the accepted standard, (Sigma Level = Cpk * 3)=3.99, this is between 3 and 4 sigma, which is equivalent to approximately 6,210 DPMO (Defects per Million Opportunities).
Cpk > 1: The process is capable and centered between the specification limits.
Cpk = 1: The process is just capable, and any slight shift may cause defects.
Cpk < 1: The process is not capable of consistently producing within specification limits.
Example Calculation
Suppose a process has the following parameters:
- USL = 10
- LSL = 2
- Process Mean (μ) = 6
- Standard Deviation (σ) = 1
Step-by-Step Calculation:
- Calculate Cp:
Cp = (USL – LSL) / (6σ) = (10 – 2) / (6 × 1) = 8 / 6 = 1.33
- Calculate Cpk:
Cpk = min((USL – μ) / (3σ), (μ – LSL) / (3σ))
Cpk = min((10 – 6) / (3 × 1), (6 – 2) / (3 × 1)) = min(4 / 3, 4 / 3) = 1.33
Interpretation
Cp = 1.33: The process has the potential capability to meet specifications.
Cpk = 1.33: The process is capable and well-centered within the specification limits.
By understanding and applying these calculations, organizations can better assess and improve their processes, thus ensuring that they consistently meet customer specifications.
A Sample SPC Chart with Points Connected
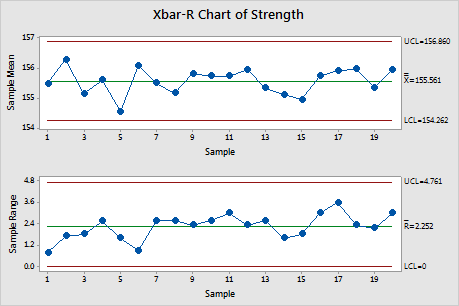
Conclusion
In this example, the X-bar and R charts indicate that the camshaft manufacturing process is within statistical control for both the average length and the variation in length. The quality engineer can continue to monitor the process using these charts, as these charts quickly identify any future out-of-control conditions or trends that may require investigation and corrective action[1][2][5].
How Can Using the Six Sigma Tools Help Achieve Operational Excellence?
Operational excellence equates to doing everything in the best possible way. Six Sigma tools help to find and fix problems so that processes run smoothly and efficiently. Below are some key Six Sigma tools:
- DMAIC:
- Define: Clearly understand the problem. For example, if customers think lemonade is sometimes too sour, that defines the problem.
- Measure: Collect data to see how often a problem occurs. Measure how much lemon juice is in each batch.
- Analyze: Look at the data to determine the cause of the problem. Maybe on hot days, you tend to add more lemon juice.
- Improve: Find a solution. Decide to measure the lemon juice more carefully.
- Control: Keep the solution in place and ensure the problem does not occur again. Regularly check lemon juice measurements.
- SIPOC:
- Suppliers: Who provides the lemons, sugar, and water?
- Inputs: What is required to make the lemonade (lemons, sugar, water)?
- Process: What are the steps to make the lemonade?
- Outputs: What is made (a cup of lemonade)?
- Customers: Who drinks the lemonade?
SIPOC helps you see the whole picture and understand where things can go wrong.
- Flowchart/Swimlane process map:
Draw a map of the steps to make your lemonade. This helps to see the process clearly and identify steps that can be improved.
- Fishbone Diagram (Cause and Effect):
Draw a fishbone diagram to determine all possible reasons for lemonade that is too sour. Causes may include too much lemon juice, not enough sugar, or incorrect measuring.
- Control Charts:
Use charts to track how much lemon juice and sugar used over time. This helps you see if things are consistent or if a problem is beginning to occur.
- Five Whys:
Ask “Why?” repeatedly to find the root cause of a problem:
- Why is the lemonade too sour? Because there is too much lemon juice.
- Why is there too much lemon juice? Because we do not measure it every time.
- Why do we not measure it every time? Because we lack a standard measuring tool.
- Why do we lack a standard measuring tool? Because no one thought it was necessary.
- Why did no one think it was necessary? Because we had no problem until now.
By using these tools, you can identify and fix problems. In this way, you ensure that everything runs smoothly and efficiently, as this is the gist of operational excellence.
Chapter Summary
References and Notes
- Montgomery, D. C. (2012). Introduction to Statistical Quality Control. John Wiley & Sons.
This book provides a comprehensive overview of statistical methods for quality control, including process capability indices.
- Breyfogle, F. W. (2003). Implementing Six Sigma: Smarter solutions using statistical methods. Wiley.
This book covers the use of process capability indices within the context of Six Sigma improvements.
- George, M. L., Rowlands, D., Price, M., & Maxey, J. (2005). The Lean Six Sigma Pocket Toolbook: A quick reference guide to 100 tools for improving quality and speed. McGraw-Hill.
This book includes practical guidance on calculating and interpreting process capability indices.
Appendix, Chapter 7
QI Macros link for a180-day free trial. www.qimacros.com/trial/student
