Appendix E
PERCENTAGE OF ILLITERACY AMONG EMIGRANTS BY NATIONALITY 1899-1903[1]
Table: D
| 1899 | 1900 | 1901 | 1902 | 1903 | ||||||
| Nationality | Total of illit. | Percent | Total of illit. | Percent | Total of illit. | Percent | Total of illit. | Percent | Total of illit. | Percent |
| Magyars | 466 | 9.5 | 2124 | 15.4 | 859 | 6.4 | 2895 | 12.2 | 2564 | 9.4 |
| Slovaks | 3913 | 24.7 | 7475 | 25.5 | 8086 | 27.7 | 8663 | 23.4 | 6632 | 19.2 |
| Slovenes | 2110 | 24.5 | 6149 | 35.7 | 6773 | 37.7 | 12132 | 40.7 | 11104 | 34.0 |
| Ruthenians | 546 | 38.8 | 1270 | 44.4 | 2634 | 49.7 | 3557 | 47.2 | 4595 | 46.6 |
| Poles | 7524 | 26.4 | 13010 | 27.7 | 13739 | 31.0 | 23272 | 33.4 | 22634 | 27.4 |
| Italians | 31783 | 40.4 | 40954 | 40.1 | 61615 | 44.7 | 80085 | 44.3 | 88795 | 38.0 |
| Russians | 198 | 11.1 | 259 | 21.5 | 166 | 24.0 | 443 | 28.5 | 1069 | 27.9 |
SLOVAK IMMIGRANTS BY PROFESSION 1899-1903[2]
Table: E
| Profession | 1899 | 1900 | 1901 | 1902 | 1903 |
| Bakers | 6 | 16 | 13 | 24 | 45 |
| Utilities workers | 253 | 278 | 286 | 2309 | 2666 |
| Butchers | 21 | 37 | 34 | 41 | 83 |
| Farmers | – | 61 | 9 | 27 | 269 |
| Agricult. workers | 441 | 1655 | 2063 | 5405 | 3807 |
| Mechanical engineers | 5 | 1 | 5 | 9 | 42 |
| Mechanics | 14 | 7 | 8 | 16 | 25 |
| Machinists | – | – | 5 | 16 | 25 |
| Smiths | 34 | 76 | 63 | 180 | 262 |
| Tailors | 26 | 48 | 56 | 89 | 190 |
| Shoemakers | 51 | 124 | 106 | 153 | 230 |
| Locksmiths | 13 | 36 | 47 | 133 | 185 |
| Carpenters | 46 | 115 | 90 | 201 | 363 |
| Laborers | 330 | 690 | 612 | 1326 | 2062 |
| Others | 2123 | 7135 | 6025 | 10716 | 13162 |
IMMIGRATION STATISTICS OF SLOVAKS BY INDIVIDUAL STATES OF USA 1699-1902[3]
Table: F
| States | 1899 | 1900 | 1901 | 1902 | Total |
| Connecticut | 763 | 1101 | 959 | 1025 | 3848 |
| Illinois | 723 | 1278 | 1132 | 2114 | 5247 |
| New Jersey | 1945 | 3505 | 2906 | 3479 | 11835 |
| New York | 2504 | 4055 | 4299 | 4904 | 15762 |
| Ohio | 827 | 1683 | 1486 | 3153 | 7149 |
| Pennsylvania | 8135 | 16085 | 16835 | 19930 | 60985 |
DISTRIBUTION OF PERSONS OF SLOVAK ORIGIN IN THE UNITED STATES BY CHIEF PLACE OF RESIDENCE[4]
Table: G
| Place | Total |
| STATES | |
| California | 18,000 |
| Colorado | 10,000 |
| Connecticut | 25,000 |
| Idaho | 2,000 |
| Illinois | 100,000 |
| Indiana | 35,000 |
| Maryland | 2,000 |
| Massachussetts | 10,000 |
| Michigan | 60,000 |
| Minnesota | 20,000 |
| Missouri | 20,000 |
| Nebraska | 25,000 |
| New Jersey | 100,000 |
| New York | 120,000 |
| Ohio | 300,000 |
| Pennsylvania | 500,000 |
| Washington | 12,000 |
| West Virginia | 15,000 |
| Wisconsin | 50,000 |
| CITIES | |
| San Francisco | 8,000 |
| Los Angeles | 10,000 |
| Denver | 7,000 |
| Pueblo | 3,000 |
| Steubenville | 40,000 |
| Youngstown | 50,000 |
| Cleveland | 130,000 |
| Bedford | 10,000 |
| Philadelphia | 25,000 |
| Allentown | 15,000 |
| Lancaster | 8,000 |
| Scranton | 30,000 |
| Wilkes-Barre | 65,000 |
| Potsville | 35,000 |
| Norristown | 10,000 |
| Reading | 7,000 |
| Easton | 3,000 |
| Harrisburg | 3,000 |
| Williamsport | 10,000 |
| Altoona | 8,000 |
| Greensburg | 50,000 |
| Johnstown | 35,000 |
| Erie | 10,000 |
| New Castle | 20,000 |
| Washington | 50,000 |
| Pittsburgh | 80,000 |
| Everett | 2,000 |
| Olympia | 5,000 |
| Tacoma | 5,000 |
| Wheeling | 10,000 |
| Clarksburg | 3,000 |
| Charlestown | 2,000 |
| Racine | 10,000 |
| Milwaukee | 20,000 |
| Bridgeport | 20,000 |
| Hartford | 5,000 |
| Lewistown | 2,000 |
| Chicago | 75,000 |
| Joliet | 5,000 |
| Deville | 2,000 |
| Springfield | 5,000 |
| East St. Louis | 8,000 |
| Quincy | 3,000 |
| Marion | 2,000 |
| Gary | 22,000 |
| Sounth Bend | 10,000 |
| Lafayette | 3,000 |
| Baltimore | 2,000 |
| Holyoke | 5,000 |
| Firchburg | 2,000 |
| Lansing | 3,000 |
| Port Huron | 2,000 |
| Saginaw | 3,000 |
| Muskegon | 5,000 |
| Bay City | 3,000 |
| Cheboygan | 2,000 |
| Marquette | 10,000 |
| Detroit | 35,000 |
| Rochester | 2,000 |
| Mankato | 2,000 |
| Minneapolis | 10,000 |
| St. Cloud | 1,000 |
| Marshall | 2,000 |
| Duluth | 3,000 |
| St. Louis | 13,000 |
| Kansas City | 7,000 |
| Omaha | 10,000 |
| Norfolk | 12,000 |
| Scotts Bluff | 3,000 |
| Camden | 2,000 |
| Asbury Park | 3,000 |
| Trenton | 17,000 |
| Morristown | 30,000 |
| Elizabeth | 5,000 |
| Hackensack | 5,000 |
| Passaic | 10,000 |
| Teaneck | 5,000 |
| Newark | 15,000 |
| Jersey City | 10,000 |
| New York City | 85,000 |
| Buffalo | 20,000 |
| Syracuse | 15,000 |
| Lima | 2,000 |
| Toledo | 5,000 |
| Athens | 3,000 |
| Warren | 10,000 |
| Columbus | 3,000 |
| Lorain | 20,000 |
| Akron | 25,000 |
| Zanesville | 7,000 |
| Canton | 8,000 |
| Wausau | 3,000 |
| Green Bay | 4,000 |
| Eau Claire | 3,000 |
| Superior | 10,000 |
Source: SLOVAKS IN THE UNITED STATES OF AMERICA (1974)
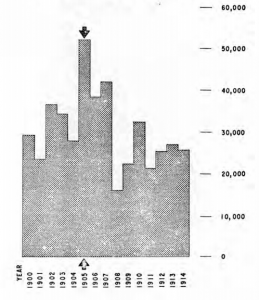
SLOVAK IMMIGRATION TO THE UNITED STATES
Source: ABC SLOVAK LANGUAGE
- Országos Levéltár -- OL. ME-XIX-1066/1904 (Hungarian National Archives, Budapest) Cit. from: Bielik Rákos: op. cit, p. 33. ↵
- Országos Levéltár -- OL. Budapest ME-XIX-1066/1904 Cit. from: Bielik Rákos: op. cit, p. 12. ↵
- Országos Levéltár, Budapest -- OL. ME-XIX-1066/1904 (Hungarian National Archives, Budapest). These statistics include only states with major immigration figures. ↵
- These figures count the Slovaks by their organizational membership, which may include Slovaks of all three generations. The accuracy of these figures may be challenged in the U.S. Census due to the use of different data gathering criteria. ↵