30 Creating Alt Text and a Long Description for Complex Informational Graphics
Heather Caprette
Images of charts, graphs and diagrams convey more information than can be conveyed with a short alt text attribute. In this case, we need to find a way to present a longer description of the data contained in the chart, graph or diagram. One way to do this would be to summarize the information within the body of the page. Another way is to represent the same data that is graphically displayed in a chart, within an accessible table, with headers and a summary. You’ll learn about how to add table headers, captions and summaries later in this module. However, I’ll show you a method of adding a complex image and its alternative text, including a long description, with the add Image feature in Blackboard Learn.
To add an image of a bar chart with an alternative text and a long description:
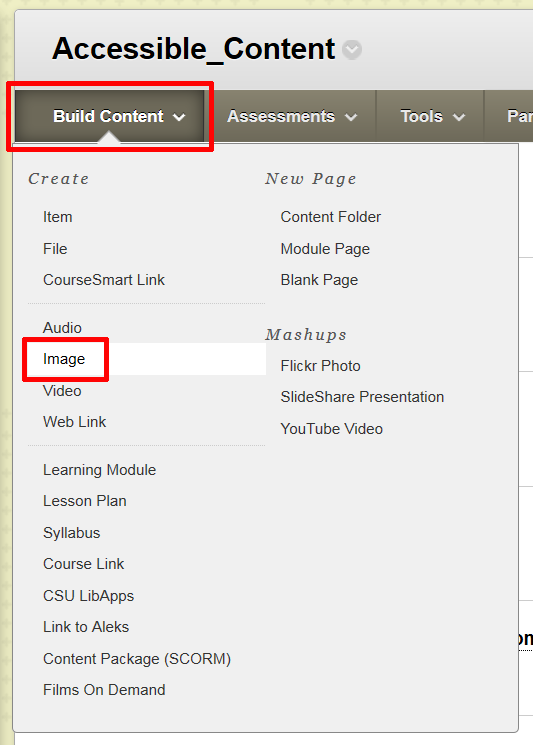
- With Edit mode set to On, there is an Actions Bar at the top center of the content region which will allow you to add content. Click on the Build Content option.
- Within the Build Content menu of this Actions Bar, select to add an Image. This menu option is shown in the image below.

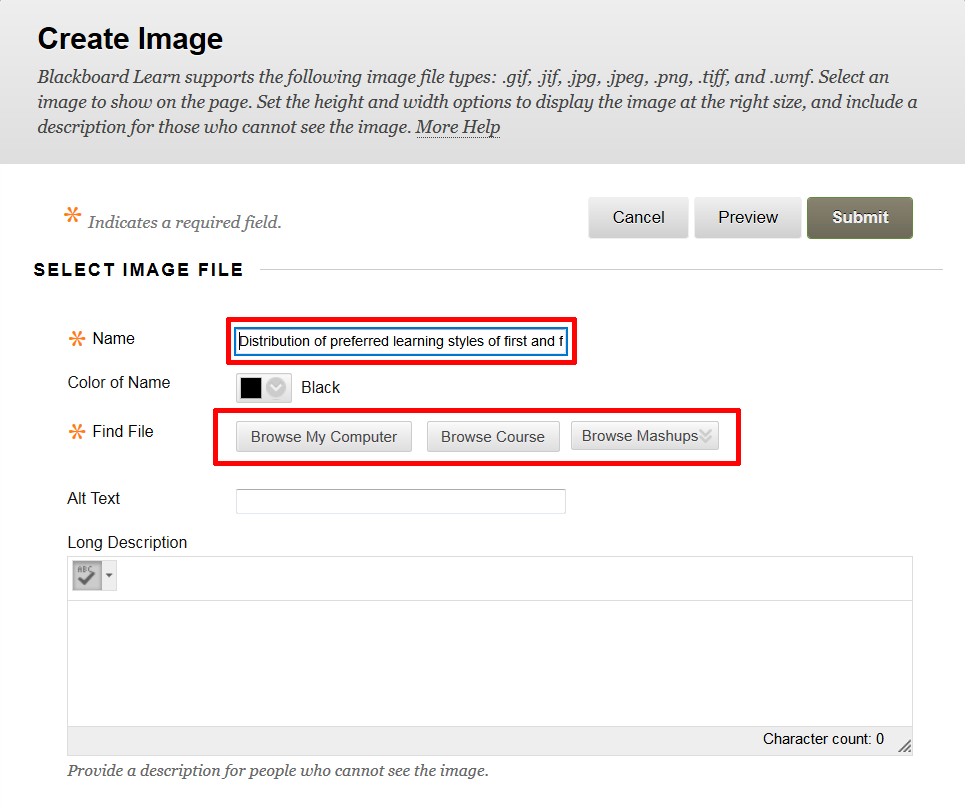
- In the Create Image dialogue box that pops up, give your data image a Name or title in the text entry box next to Name. This should express what the data or information is about. In the final display, it will show above the image of the chart, graph or diagram.
- Next, you can locate the image file by browsing your computer, the course files (provided you’ve already uploaded the file to the course), or select a Flickr Photo from the Mashups feature. Select one of the Browse buttons below the Color of the Name box (defaults to black).

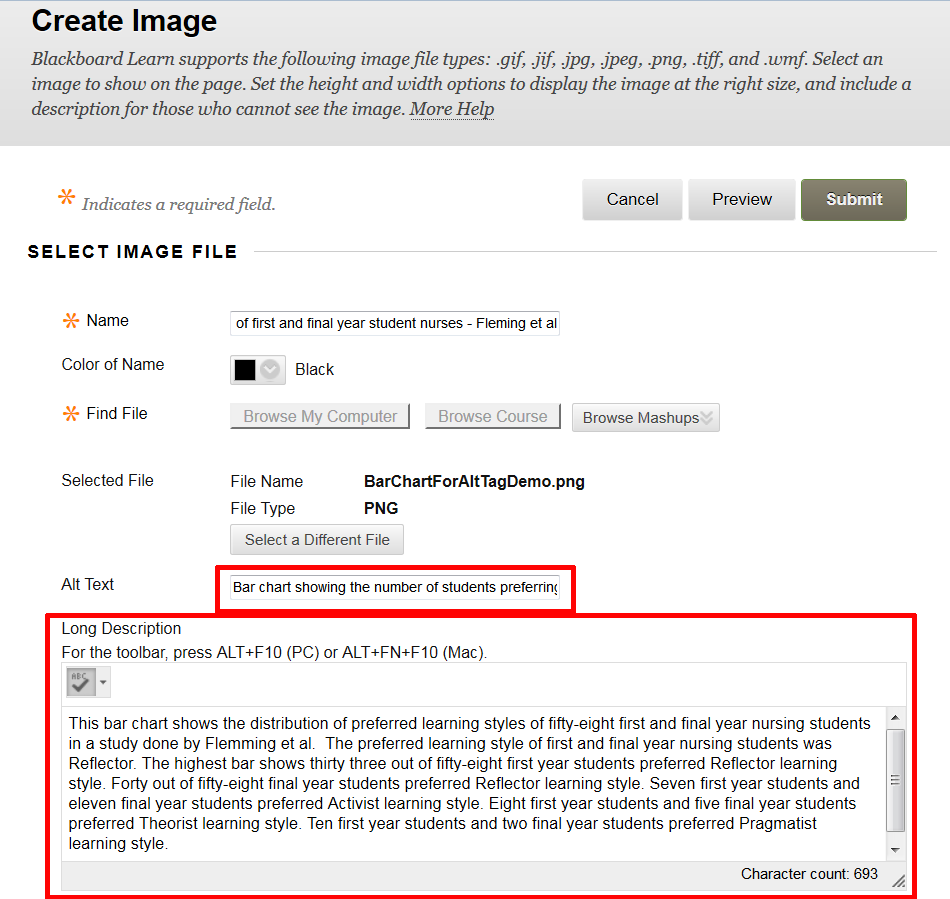
- Enter a short, concise alternative description of the data represented by the chart, graph or diagram in the text entry box next to Alt Text. The Alt Text will not be seen by sighted users viewing the image on the page, but will be read by screen readers.
- Next, in an accurate way, describe all of the information conveyed by the chart, graph or diagram. This will be written in the Long Description text entry box. In the final display, the Long Description will show beneath the image of your chart, graph or diagram. Write the long description as if you are conveying the information to someone on the other end of a phone call.

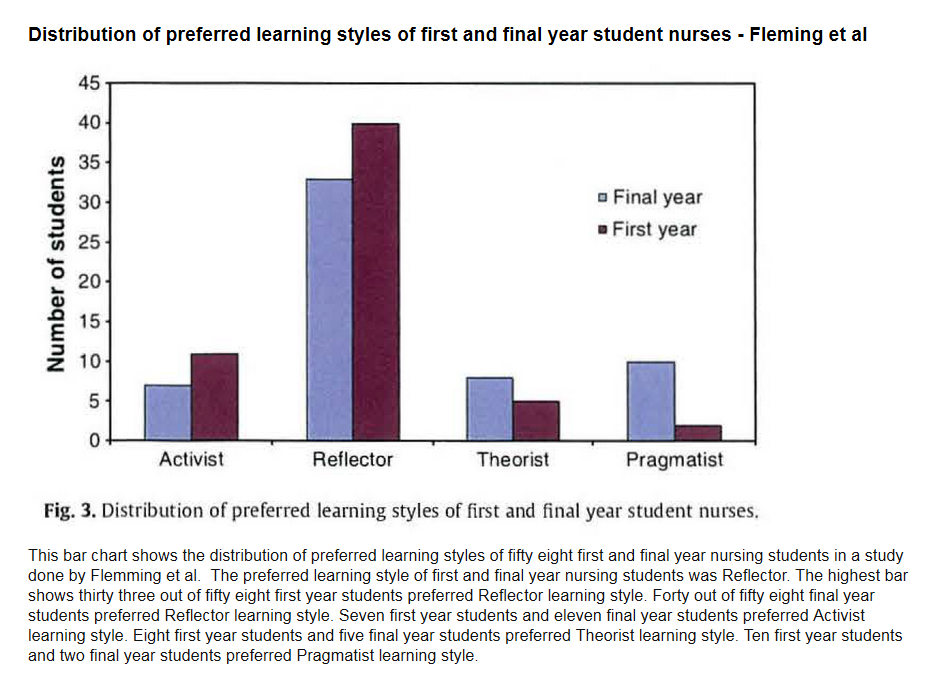
The final chart shows with its name above it and its description below, as represented in the image below.


