Main Body
2 CH 2 – Business Analytics
Introduction to Business Analytics
Think about the last time you opened TikTok. Within minutes, sometimes seconds, your For You page was already serving up videos that felt hand-picked just for you. Funny enough, they basically were. TikTok’s algorithm is constantly analyzing data: what you watch all the way through, what you skip, what you like, what time of day you’re scrolling, and hundreds of other signals, all to predict what will keep you on the app longer.
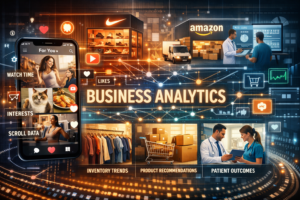
But here is the bigger picture. That same process of collecting data, finding patterns, and making smarter decisions is exactly what companies across every industry are doing right now. Nike uses it to decide which products to stock in which cities. Amazon uses it to predict what you will buy before you even search for it. Hospitals use it to improve patient outcomes. This is , and whether you realized it or not, it has been shaping your daily life for years. By the end of this chapter, you will not just understand what business analytics is. You will start seeing it everywhere.
CHAPTER OUTLINE
2.1: What is Business Analytics?
Definition and scope
The role of data in modern business decision-making
Business Analytics vs. Business Intelligence vs. Data Science
2.2: The Three Types of Business Analytics
Descriptive Analytics – understanding what happened
Predictive Analytics – forecasting what might happen
Prescriptive Analytics – recommending what should be done
2.3: Why Business Analytics Matters
Competitive advantages of data-driven decisions
Real-world impact across industries (retail, finance, healthcare, etc.)
The growing demand for analytics skills in the workforce
2.4: Key Components of a Business Analytics Framework
Data sources and data collection
Data management and storage
Tools and technologies (Excel, SQL, Tableau, Python, etc.)
Communicating insights to stakeholders
2.5: The Business Analytics Process
Define the business problem
Collect and prepare data
Analyze the data
Interpret and visualize results
Make and implement decisions
2.6: Careers and Roles in Business Analytics
Business Analyst
Data Analyst
Analytics Manager
Paths into the field and skills to develop
2.7: Chapter Summary and Key Takeaways
2.1: What is Business Analytics
Every day, businesses are faced with thousands of decisions. Should we lower our prices? Which customers are most likely to leave? Where should we open our next location? Not long ago, most of those decisions were made based on experience, intuition, and gut feeling. Today, companies have a better tool: data.
Business analytics is the practice of using data to make smarter business decisions. It involves collecting information, organizing it, analyzing it, and then using what you find to guide strategy and solve problems. In short, it turns raw numbers into useful answers.
You do not need to be a math genius to understand business analytics. At its core, it is about asking good questions and using available information to answer them. The math and technology are just the tools that help you get there.
*It is worth noting that business analytics is often confused with a few related terms. Business Intelligence focuses on reporting what has already happened, essentially looking in the rearview mirror. Data Science goes deeper into complex modeling and artificial intelligence. Business Analytics sits in the middle, using data from the past to make informed decisions about the future.
2.2: The Three Types of Business Analytics
Not all analytics work the same way.
There are three main types, and each one answers a different kind of question.
WHAT HAPPENED?
Descriptive Analytics looks at what already happened. It summarizes past data to give you a clear picture of where things stand. It’s sometimes called the simplest form of data analysis because it describes trends and relationships but doesn’t dig deeper. If a company pulls up a report showing that sales were down 10% last month, that is descriptive analytics at work. Think of it like checking your bank account balance. You are not predicting anything yet. You are just getting the facts.
IRL Example
Think about something super relevant: your phone’s screen time report.
Every week, your phone shows you stats like:
- You spent 18 hours on TikTok
- You checked Instagram 95 times
- Your daily average was 5 hours
That is descriptive analytics.
👉 It’s not telling you:
- why you used your phone that much
- or what you’ll do next week
👉 It’s just answering:
- “What already happened?”
It’s like your phone saying, “Here are the facts about your behavior last week.”
“WHAT MIGHT HAPPEN IN THE FUTURE?”
Predictive Analytics takes things a step further by asking what is likely to happen next. It uses patterns from past data to forecast future outcomes. Spotify uses predictive analytics when it guesses which songs you will want to hear next. Your bank uses it to flag transactions that look suspicious before you even notice something is wrong. Forecasting can help to make better decisions and formulate data-informed strategies.
IRL EXAMPLE
An example of predictive analytics at work are your Netflix recommendations.
When you open Netflix, it suggests shows like:
- “Because you watched Outer Banks, you might like All American”
👉 That’s predictive analytics.
Netflix is using your past behavior (what you watched, how long you watched, what you skipped) to predict what you’ll want to watch next.
Simply:
- Descriptive = “You watched 10 hours last week”
- Predictive = “You’ll probably like this next”
“WHAT SHOULD WE DO NEXT?”
Prescriptive Analytics goes one step further and recommends what you should actually do about it. It does not just tell you what happened or what might happen. It tells you what action to take. When Google Maps reroutes you around traffic in real time, that is prescriptive analytics. The system analyzed the situation and told you the best move to make.
Prescriptive analytics looks at all the data and tells you what you should do next often using computer programs (machine learning) to quickly sort through tons of information much faster than a person can to give the best recommendation.
IRL EXAMPLE
Many colleges use systems such as Degree Planner, Starfish, or Ellucian Degree Works that do more than just show your grades or predict your GPA. They prescribe what you should do next to graduate on time.
Here’s how it works (and why it’s prescriptive analytics):
- The system gathers your data: what classes you’ve taken, your current major requirements, prerequisites, and how many credits you need.
- It runs models that understand the best path to graduation (e.g., which electives satisfy requirements, which courses are sequenced properly).
- Then it recommends actions you should take such as:
- “Register for MATH 121 next semester because it’s a prerequisite for STAT 200.”
- “Take ENG 102 now — it’s only offered in the spring and you need it to stay on track.”
- “Add one of these electives to reach 120 credits this year.”
🔹 This isn’t just analysis or prediction — it’s telling you the optimal next steps to meet your goal of graduating on time. That’s prescriptive analytics in action.
Think of the three types as a progression. Descriptive tells you the score. Predictive tells you who is likely to win. Prescriptive tells you what play to run next.
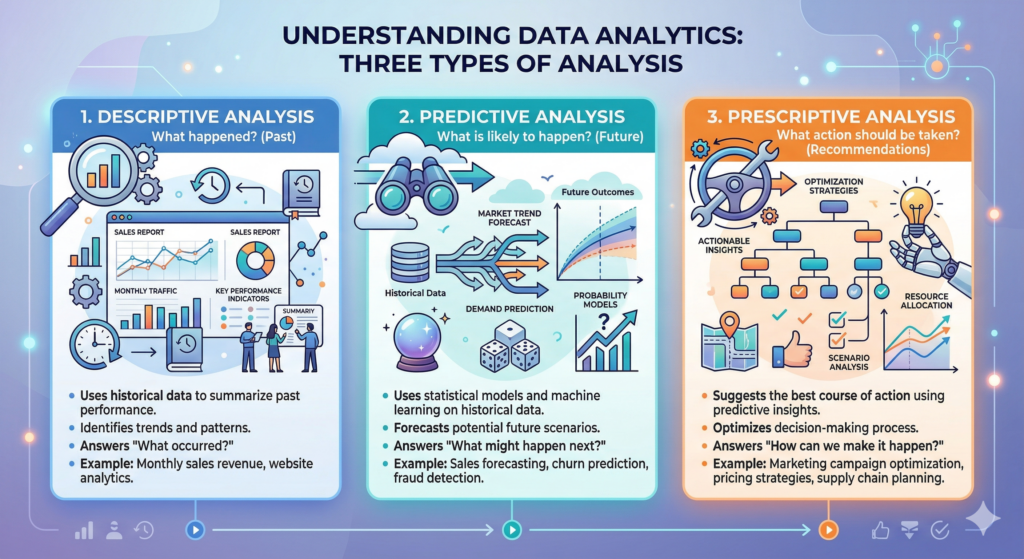
Now that we’ve seen the three types of business analytics, we understand how businesses can look at the past, anticipate the future, and make smart decisions in the present. Each type builds on the previous one, turning raw data into actionable insights. With this foundation, it’s easy to see why business analytics isn’t just about numbers, it’s a critical tool for making smarter, faster, and more effective business decisions. That’s exactly what we’ll explore in the next section: Why Business Analytics Matters.
2.3: Why Business Analytics Matters
You might be wondering why analytics has become such a big deal.
The short answer is that data is now everywhere, and the companies that know how to use it have a serious competitive advantage over those that do not.
Here is a simple truth: companies that use data well tend to outperform companies that do not. Analytics gives businesses a competitive edge by removing guesswork from the equation.
For you as a future professional, this matters for a very practical reason.
The ability to work with data and communicate insights is one of the most in-demand skills in today’s job market, across nearly every field.
Whether you go into marketing, finance, healthcare, sports, or entrepreneurship, analytics will be part of your world.
Why Business Analytics Matters to a College Student:
Business analytics isn’t just for big companies; it can directly impact you as a student:
- Make smarter decisions with your time and money – Analytics can help you figure out which classes, study habits, or campus resources give you the best outcomes, so you don’t waste time or credits.
- Prepare for jobs and internships – Companies want employees who can understand data, spot trends, and make recommendations. Knowing analytics gives you a real skill that makes your resume stand out.
- Understand the world around you – From tracking social media trends, to sports stats, to budgeting your personal finances, analytics helps you see patterns and make better choices in everyday life.
- Solve problems faster – Being able to analyze information and suggest solutions is a skill that applies to group projects, campus organizations, or even starting your own side hustle.
In short: Business analytics matters because it teaches you how to make smarter decisions, plan ahead, and create opportunities – skills that are useful in school, work, and life.
Consider two coffee shops side by side. One tracks which drinks sell best at which hours, which promotions bring in new customers, and which days of the week are slowest. The other just makes coffee and hopes for the best. Over time, the first shop makes smarter decisions about staffing, pricing, and marketing. The gap between them grows wider every month, not because one makes better coffee, but because one is making better decisions.
This plays out at massive scale in the real world. Amazon’s entire business model is built on analytics. From product recommendations to warehouse placement to delivery routing, data drives nearly every decision the company makes. Target famously used analytics to identify which customers were likely pregnant based on shopping patterns, allowing them to send relevant coupons before competitors even knew those customers existed. Whether you find that impressive or a little unsettling, it illustrates just how powerful analytics can be.
You do not have to want to be a data scientist to benefit from understanding how analytics works.
Examples of Business Analytics in Practice
- “What is business analytics? Using data to improve business outcomes” – a clear article with real cases (like sports team analytics and healthcare operations improvements) illustrating how analytics helps organizations improve results.
- Databox: “5 Real‑World Business Analytics Examples That Prove the Value of Business Intelligence” – shows how companies use analytics for strategy and growth and why it leads to better decisions and performance.
- Wake Forest University: “Why is Business Analytics Important?” – gives real industry examples from retail, airlines, healthcare, and manufacturing showing analytics improving pricing, patient care, supply chain, and more.
- SCDL: “Real‑World Use Cases of Business Analytics Across Industries” – highlights analytics in banking, retail, e‑commerce, and more (good for diverse examples across sectors).
2.4: Key Components of a Business Analytics Framework
Business analytics does not happen by accident. There is a structure behind it, and most organizations follow a similar framework.
It starts with data sources. Data can come from almost anywhere: sales records, customer surveys, website traffic, social media activity, inventory logs, and more. The first step is knowing where your data lives and how to access it.
Next comes data management. Raw data is often messy. It might have missing entries, duplicate records, or inconsistent formatting. Before you can analyze anything, the data needs to be cleaned and organized. This step is less glamorous but incredibly important.
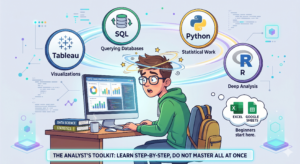
Then comes the tools and technology used to actually do the analysis. Beginners often start with . More advanced analysts use tools like for visualizations, for querying databases, and for deeper statistical work. You do not need to master all of these right away, but knowing they exist is a good start. (see sidebar for more info on these programs)
Finally, there is communication. Finding insights in data is only half the job. The other half is explaining what you found to people who may not have a data background. This is arguably the most underrated component. Even the most brilliant analysis is useless if the results cannot be explained clearly to the people who need to act on them. Turning data into a story that non-technical stakeholders can understand is one of the most valuable skills a business analyst can have.
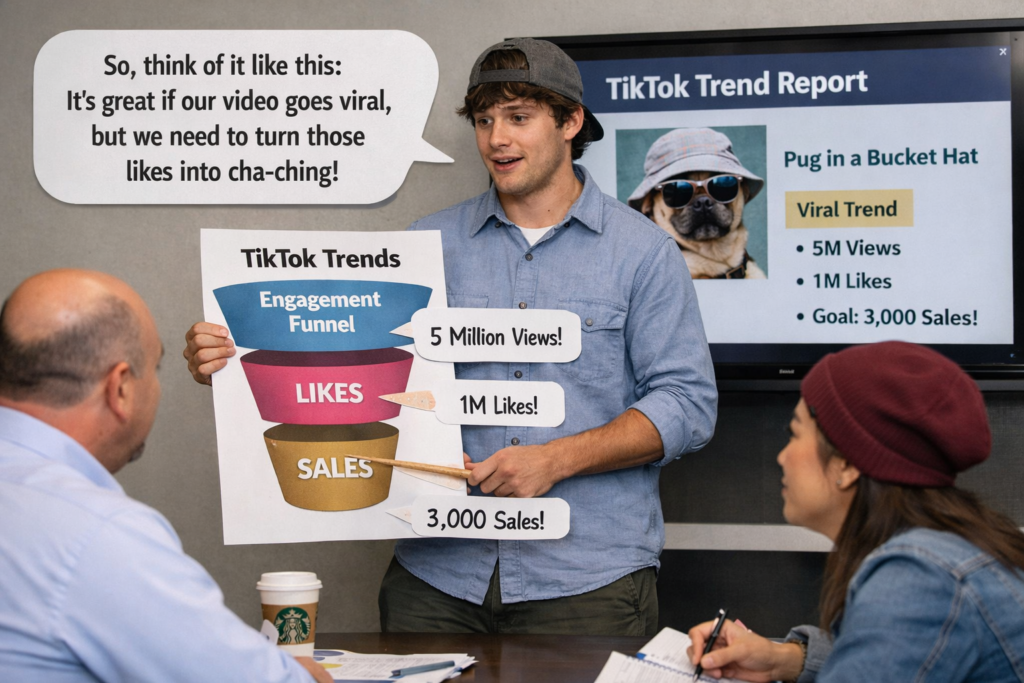
TikTok’s official “Success Stories” library includes many brands that used analytics‑informed approaches to improve outcomes:
- Toyota achieved a 38% reduction in cost per acquisition (CPA) using tailored TikTok ads,
- Supercell (Clash Royale) drove higher engagement with TikTok‑native creative,
- Pringles and Ben & Jerry’s used analytics‑informed campaigns that expanded reach and boosted results.
These are real world companies using analytics insights (like engagement patterns and creative performance) to shape their content and marketing decisions.
Brands like Bold and global advertisers like Toyota used TikTok analytics to measure what works and what doesn’t. By analyzing content performance and running tests, they were able to adjust their strategies, lower costs, increase engagement, and drive conversions. This shows that analytics are not just about numbers, they lead to real business outcomes when communicated and acted upon. Or checkout this free TikTok report analyzer where you can enter your company and see how you are doing against your competitors.
That’s the crux of business analytics in action.
Next, we will look into the Business Analytics process.
2.5: The Business Analytics Process
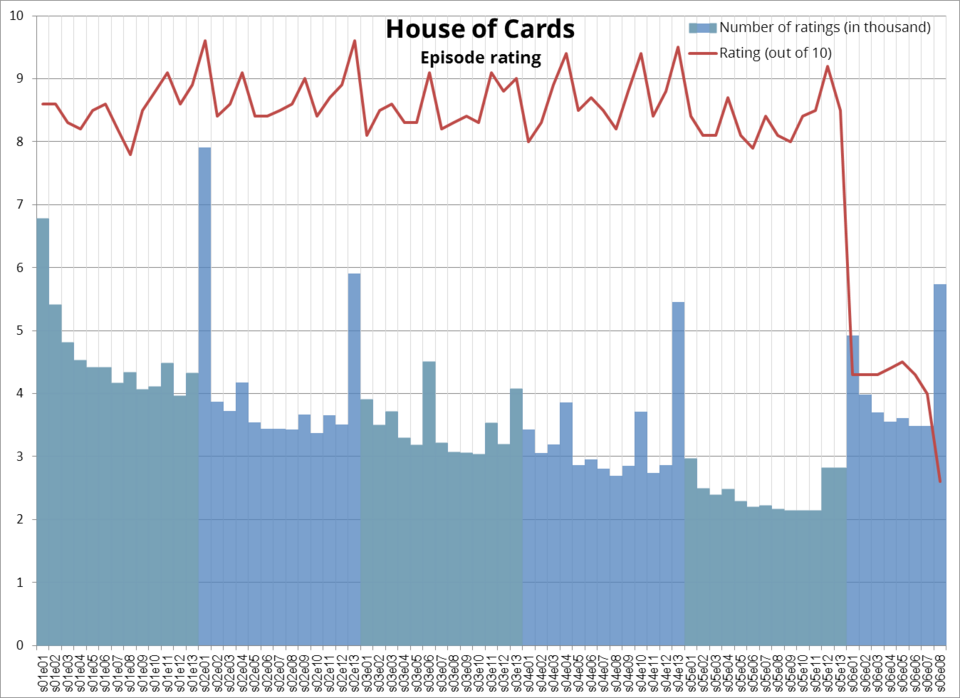
In 2011, Netflix made a bet that would have seemed reckless to most executives: they committed $100 million to produce a TV series called House of Cards before a single episode had been filmed. No pilot. No test audience. No guesswork. They already knew it would work, because the data told them so.

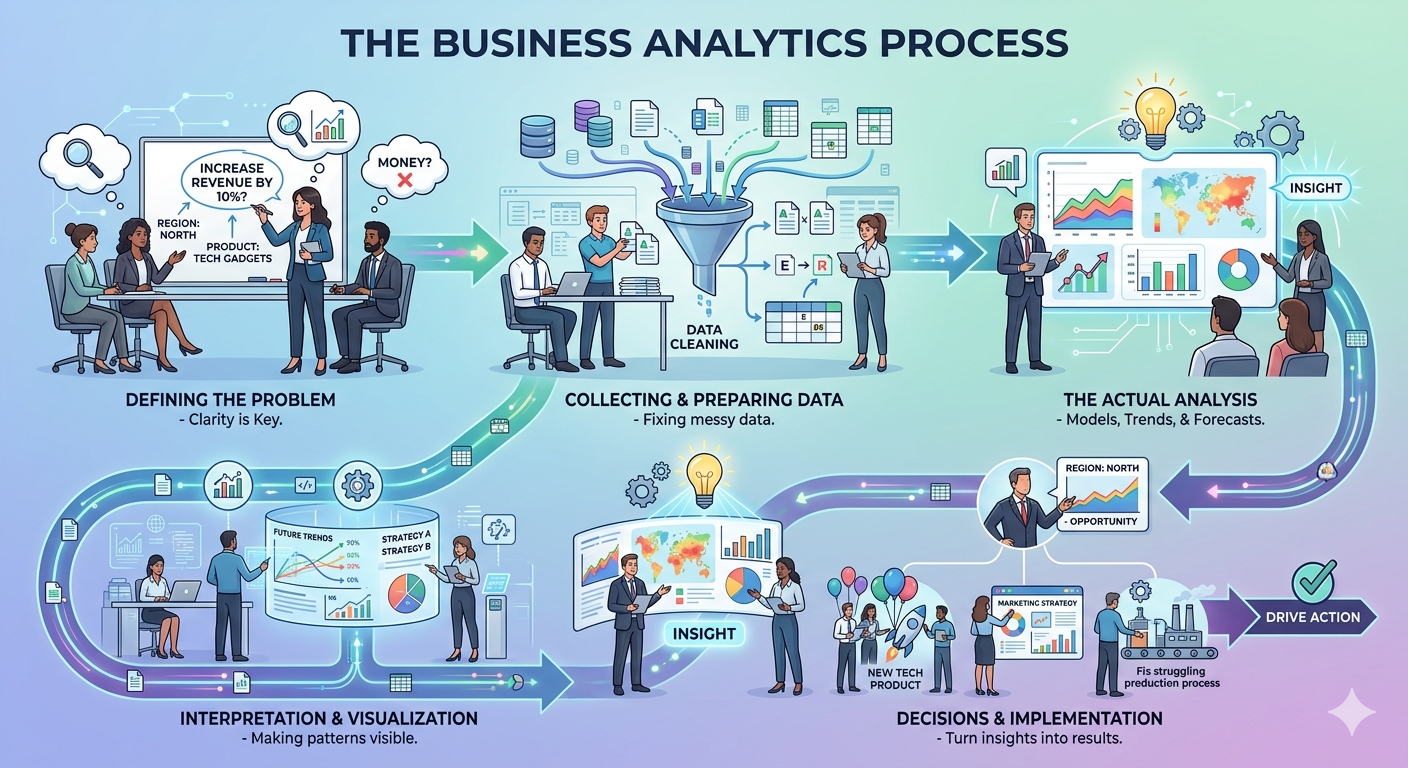
Their story is a good one to keep in mind as we walk through how analytics actually works in practice. While every project is different, most analytics work follows the same basic path from start to finish.
It starts with defining the problem.
Netflix’s question was specific: what kind of original content will our subscribers actually watch and love? Not “what should we make?” but a sharper, more answerable question built around real viewer behavior. A vague question leads to a vague answer. The more specific the problem, the more useful the outcome.
Next comes collecting and preparing data.
This step is less glamorous than it sounds. Netflix had mountains of data on what people watched, rewatched, paused, abandoned, and searched for. But raw data is messy. It has gaps, errors, duplicates, and inconsistencies. A significant portion of any analytics project is simply cleaning the data until it is reliable enough to work with. Nobody puts this part in the highlight reel, but skipping it is how projects go wrong.
Then comes the actual analysis.

Netflix dug into their data and found something interesting. Their subscribers loved films directed by David Fincher. They loved actor Kevin Spacey. They loved the original BBC version of House of Cards. Three separate signals, pointing in the same direction. Depending on the problem, analysis might involve spotting trends, building forecasts, running experiments, or comparing different scenarios. This is where the tools and methods really earn their place.
After that comes interpretation and visualization.
Raw numbers rarely tell a clear story on their own. Charts, dashboards, and well-designed visuals make patterns visible and results easier to communicate to decision-makers who were not sitting in the weeds with the data. An insight that takes an analyst three weeks to find should not take an executive three hours to understand.
Finally, decisions get made.
Netflix greenlit the show. The whole point of the process is to drive action. A recommendation gets made, a strategy shifts, a new product launches, or a struggling process gets fixed. In Netflix’s case, House of Cards became one of the most talked-about shows of the decade and helped establish them as a serious content studio.
Analytics without action is just an academic exercise. The data was never really about the show. It was about confidence: the kind that lets you spend $100 million without blinking.
More Reading:
How Netflix Used Date to Create House of Cards: A Revolutionary Approach to Content Creation
House of Cards: How Netflix’s $100m gamble made them internet video kings
🔗 Read more:
Harvard Business School Online has a clean, readable piece with real company examples (Microsoft, Uber, PepsiCo, and others) that map well to this chapter’s themes: https://online.hbs.edu/blog/post/business-analytics-examples
2.6: Careers and Roles in Business Analytics
One of the best parts about business analytics as a field is how many different directions it can take you. The skills are versatile and apply across almost every industry you can think of.
A Business Analyst typically works inside a company to identify problems, gather data, and recommend solutions. They act as a bridge between the technical side of data and the business side of decision-making. This is one of the most common entry-level roles for graduates with an analytics background.
A Data Analyst is more focused on the numbers themselves. They spend more time working directly with data, building reports, and creating dashboards. Strong Excel and SQL skills are usually expected for this kind of role.
An Analytics Manager leads a team of analysts and is responsible for the overall strategy behind how a company uses its data. This is typically a role people grow into after several years of experience.
Beyond these titles, analytics skills show up in marketing, finance, operations, human resources, and even in creative industries. Music streaming platforms like Spotify use analysts to understand listener behavior. Sports franchises hire analysts to evaluate player performance. Video game companies use analytics to understand how players interact with their games and where they get frustrated or drop off.
The demand for these skills is not going away. If anything, it is growing. Starting to build familiarity with analytics concepts now puts you ahead of the curve before you even enter the job market.
FURTHER READING:
2.7: Chapter Summary and Key Takeaways
Business analytics is the practice of using data to make better business decisions. It includes three main types: descriptive analytics, which explains what happened; predictive analytics, which forecasts what might happen; and prescriptive analytics, which recommends what to do. Analytics is powered by data sources, storage systems, software tools, and the ability to communicate findings clearly. The analytics process moves from defining a problem all the way through to implementing a decision. Careers in this field span nearly every industry and are consistently among the most in-demand in today’s economy.
The most important takeaway is this: data is not just numbers on a spreadsheet. In the right hands, it is one of the most powerful decision-making tools in the modern world.
EXTRA LEARNING RESOURCES
Collective data, finding patters, and making smarter decisions
Foundational tools used for data organization and basic analysis by beginners
Business intelligence and visualization tools that turn data into interactive dashboards
The standard language for querying and managing data from databases
Programming languages used for deeper analytics, statistical modeling, and automation