Main Body
8 CH 8 – Accounting
Imagine you’re invited to play the most high-stakes poker game in the world. The buy-in is your entire life savings. You sit down, and you realize… you don’t know the rules. Everyone else is speaking a language you don’t understand, and they are taking your money while you smile and nod.
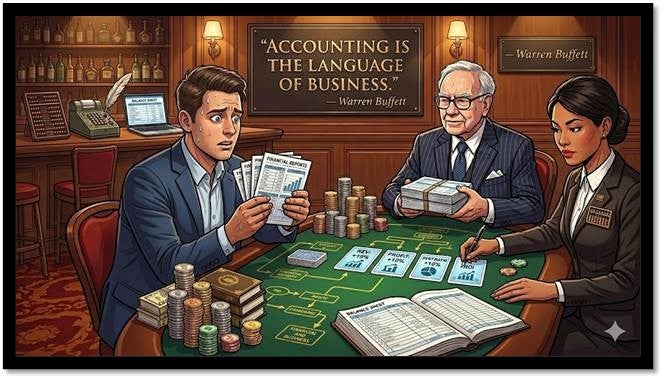
In the world of business, that language is Accounting. If you don’t know it, you aren’t a player, you’re just a spectator watching someone else spend your money. Even if you want to be a YouTuber, a doctor, or a high-end designer, if you can’t read a profit and loss statement, you’re just an employee for someone who can.
Accounting aims to provide users with relevant and timely information to help them make good economic decisions.
The Warren Buffett quote. “Accounting is the language of business,” emphasizes that you can’t play the game if you don’t know how to read the scoreboard. It positions accounting as a vital skill rather than a chore. Essentially, it’s like keeping a detailed record of all the money that comes in and goes out, which helps make better financial decisions.
CHAPTER OUTLINE
8.1: Who does it?
8.2: Branches of Accounting
8.3: Ethics in Accounting
8.4: Accounting Terms
Do you want to make this a career?
Don’t want to make this a career?
8.1 Who does it?
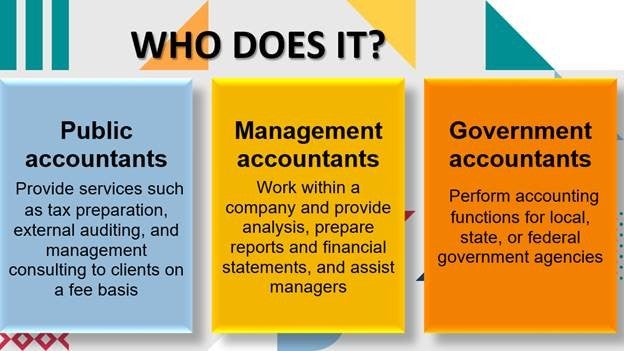
Public accountants prepare tax reports, perform external audits, and give advice to companies.
Management accountants assist managers and analyze and prepare reports and financial statements.
Government accountants perform different accounting functions for local, state, or federal government agencies.
Accountants need expertise in complex subjects. That is why many of them take certified courses. Certified public accountants (CPAs) are certified to audit the accounting records of public and private organizations and to attest to compliance with generally accepted accounting rules. The offices of CPAs may provide one or more of the following accounting services:
- Auditing financial statements
- Designing accounting systems
- Preparing financial statements
- Developing budgets
- Providing advice on matters related to accounting
These establishments may also provide related services, such as bookkeeping, tax return preparation, and payroll processing.
8.2 Branches of Accounting
Financial Accounting involves preparing financial statements that help stakeholders understand their firm’s performance through the years and compare the firm’s performance with that of its competitors. Stakeholders need this information to analyze the financial condition of the firm. Investors compare a company’s financial results to other firms in the same industry. The major output of financial accounting (balance sheets, income statements, cash flows) provides fundamental information about a company’s past and future financial performance.
Managerial Accounting provides reports and analysis to managers to help them make informed business decisions. A firm’s performance depends on the accuracy and reliability of this information.
Think of it this way: A company has two different audiences that need financial information: people inside the company and people outside it. Each audience gets a different type of accounting.
Financial Accounting = Reporting to Outsiders
This is the “official” scoreboard. It’s designed for investors, banks, the IRS, and regulators – people outside the company who want to know: “Is this company healthy? Should I invest or lend money?”
It follows strict rules (called GAAP) so everyone can compare companies apples-to-apples. Think annual reports, balance sheets, income statements. It looks backward, summarizing what has already happened.
Managerial Accounting = Reporting to Insiders
This is the internal dashboard. It’s designed for managers and executives who need to make decisions: “Should we launch this product? Where are we losing money? How do we cut costs?”
No strict rules here – companies report whatever is useful to them. It looks both backward (what happened) and forward (budgets, forecasts, projections).
While a regular accountant looks at your finances to make sure the math adds up and your taxes are paid, a forensic accountant looks at the numbers to find out if someone is lying, stealing, or hiding something. Forensic Accounting is a specialized field of accounting that involves investigating financial records to detect fraud, inefficiencies, and government waste. It combines accounting, auditing, and investigative skills to analyze financial data and uncover misconduct. Forensic accountants work in law enforcement, government agencies, corporations, and firms to protect financial integrity.
Key Skills Needed
To do this job, you need a specific “toolbox”:
-
Skepticism: They don’t take any document at face value.
-
Attention to Detail: They find the one-cent discrepancy that leads to a million-dollar theft. They need to be able to verify numbers.
-
Data Analysis: They use software to scan thousands of transactions in seconds to find patterns.
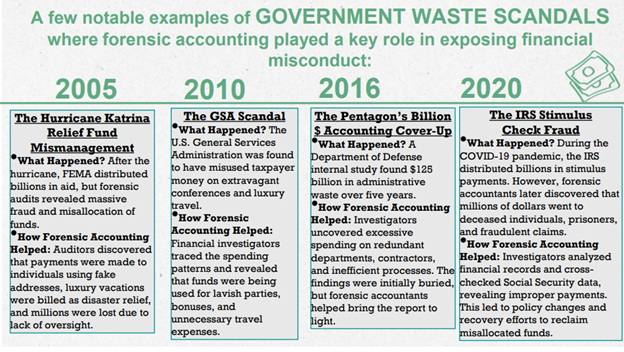
These cases show how forensic accounting plays a vital role in ensuring accountability and preventing misuse of taxpayer money.
8.3: Ethics in Accounting
Real-world companies have collapsed because of “creative” math. Whether it’s hiding massive debt or faking profits, these scandals prove that accounting isn’t just about numbers—it’s about trust. Because of past disasters, the profession now has a zero-tolerance policy for unethical behavior.
Who Makes the Rules?
Think of these organizations as the “referees” of the financial world:
- The SEC (Securities and Exchange Commission): The government agency with the ultimate legal power.
- The FASB (Financial Accounting Standards Board): The private group the SEC trusts to write the actual rulebook.
- GAAP (Generally Accepted Accounting Principles): The “ground rules” themselves.
The Goal of GAAP: To ensure financial statements are clear, honest, and consistent so that everyone, from investors to employees, can trust the data.
The “Big Four” Requirements
To follow GAAP, every financial statement must be:
- Understandable: It actually helps people see if the company is healthy.
- Reliable: Based on objective, verifiable facts (not “gut feelings”)
- Consistent: Uses the same math methods year after year.
- Comparable: Formatted so you can easily compare a company’s performance over time.
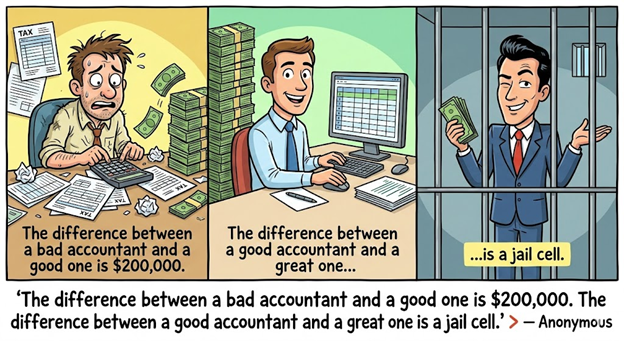
The Most Famous Accounting Disaster: Enron
If you’ve never heard of Enron, it’s worth a quick look. Watch it explained in one minute.
In short: Enron hid massive debts and faked profits, fooling investors for years. But here’s the kicker — their accounting firm, Arthur Andersen, actually knew. Instead of blowing the whistle, they helped cover it up, even shredding documents. Arthur Andersen had been in business for 90 years, survived the Great Depression, and employed 85,000 people worldwide. One series of unethical decisions ended all of it.
The lesson? Ethical failures don’t only destroy the people who commit fraud. They take down everyone around them too.
It Can Happen at Any Scale: The Fall of Sam
You don’t need to be at a Fortune 500 company for ethics to matter. Consider Sam.
Sam landed his first accounting internship at a small, cool sneaker company; free shoes, espresso bar, and skateboarding sponsorships. He was thrilled.
One Friday, he was reconciling petty cash and found it was off by exactly $5. He checked everything twice but couldn’t track it down. His stressed supervisor shrugged: “Just adjust it. It’s only five bucks.”
Sam felt uneasy, but he didn’t want to be the intern who made a big deal over nothing. So, he made the adjustment and moved on.
A month later, an internal audit revealed thousands of dollars missing from the same fund. Someone had been skimming small amounts over time, and the fake “adjustments” had been covering the trail. The audit led straight back to Sam’s report.
Sam hadn’t stolen anything. But his signature was on the falsified record, and that was enough. His internship was terminated, and the incident followed him through college.
Sam later said the hardest part wasn’t losing the internship; it was realizing that ethical mistakes don’t always come from greed. Sometimes, they come from going along with something that “seems small.”
Key Takeaway
In accounting, every dollar counts …. and so does every decision. Ethics isn’t just about avoiding fraud. It’s about having the courage to speak up even when the problem seems minor, especially when someone in authority tells you not to worry about it.
Red flags don’t come with warning labels. That’s why your judgment matters from day one.
*Click here to learn about some current accounting scandals:
Three of the worst accounting scandals in history
8.4 Accounting Terms
Cost
What you give up to get something
This is broader than just money. When you spend $10 on a pizza, the cost is $10. But if you use your Saturday afternoon to bake one yourself, the cost includes your time too (even if you paid nothing.)
The “cost” of anything is everything you sacrifice to get it.
Out-of-Pocket Cost
Money actually leaving your wallet
This is the straightforward one. You pay cash (or resources) and it’s gone.
Example: You open a coffee shop and pay $2,000/month in rent, $500 for supplies, and $1,200 in employee wages. All of these are out-of-pocket costs; real dollars flowing out.
Implicit Cost
What you gave up that doesn’t show up on a receipt
It’s the opportunity cost of using your own resources instead of the next best alternative.
Example: You quit your $60,000/year job to run your own bakery. The bakery earns $50,000 profit. Looks good on paper, but you implicitly lost $60,000 in salary you could have earned. That forgone salary is an implicit cost. Your bakery is actually costing you money when you factor it in.
Another example: You use a building you own for your business instead of renting it out for $1,500/month. That $1,500 you’re not collecting is an implicit cost.
Fixed Costs
Costs that don’t change no matter how much you produce
These are the bills you pay whether you’re slammed with orders or sitting idle.
Example: Your bakery pays $3,000/month in rent. It doesn’t matter if you bake 10 cakes or 1,000 cakes that month, rent is still $3,000. Same goes for insurance, equipment loans, or a salaried manager’s pay.
The “relevant range” part just means this holds true within normal operating levels. If you somehow needed to rent a second building, your fixed costs would jump.
Variable Costs
Costs that rise and fall with how much you produce
The more you make, the more these cost. The less you make, the less they cost.
Example: Every cake at your bakery requires flour, eggs, and butter. If you bake 100 cakes, you buy 100 cakes worth of ingredients. If you bake 500 cakes, you buy 5x the ingredients. Labor for hourly workers works the same way: more production means more hours, means more wages.
Direct Costs
Costs you can point straight at a specific product
These are easy to trace. You look at a sneaker and say “yep, that cost came from making this shoe specifically.”
Examples:
- The leather used to make the shoe → direct cost
- The rubber sole attached to that shoe → direct cost
- The worker hours spent stitching that specific shoe → direct cost
If the cost disappears when you stop making that product, it’s almost certainly a direct cost.
Indirect Costs
Costs that keep the whole operation running, but can’t be pinned to one product
These are trickier. They’re real costs, but they benefit everything you make, not just one specific product.
Examples:
- The factory’s electricity bill → powers the whole building, not just one sneaker
- The factory manager’s salary → oversees all products
- Rent on the building → shelters every product you make
- Cleaning supplies → used everywhere
You can’t look at a sneaker and say “this shoe used exactly $4.17 of electricity.” So indirect costs have to be estimated and spread across all your products, which is where things get complicated.
The Problem Indirect Costs Create
The old simple approach was to just take all indirect costs and spread them evenly across everything you make. For example: “We spent $100,000 on overhead this year and made 10,000 sneakers, so we’ll assign $10 of overhead to each shoe.”
But what if some sneakers are simple and some are incredibly complex, requiring way more machine time, inspections, and special handling? Spreading costs evenly would make the simple shoe look more expensive than it is, and the complex shoe look cheaper than it is. That leads to bad pricing decisions.
That’s the problem Activity-Based Costing solves.
Activity-Based Costing (ABC)
Assign costs based on what actually drives them
The idea is simple: costs are caused by activities. Instead of spreading indirect costs evenly, you figure out which activities consume resources, and then assign costs based on how much of those activities each product actually uses.
The process in plain English:
- Identify the activities that cause costs (things like machine setup, quality inspections, shipping, customer service calls, etc.)
- Assign costs to each activity; figure out what each activity actually costs the business
- Figure out what drives each activity (called a cost driver) – for example, machine setups are driven by the number of setups, inspections are driven by number of inspections, etc.
- Assign costs to products based on how much of each activity that product actually uses
The Big Takeaway
Think of it like splitting a dinner bill. The old way is everyone pays equally. ABC is everyone pays for what they actually ordered. It’s fairer, and it leads to smarter business decisions around pricing, which products to push, and where you’re actually making (or losing) money.
The McDonald’s Example
McDonald’s is actually a perfect real-world case of exactly this problem.
The Setup
For decades, McDonald’s tried to compete with places like Subway and Chipotle by adding healthier, more complex items to their menu (salads, wraps, customizable burgers, fruit parfaits, artisan sandwiches.) On paper, these items had decent profit margins. Looked good in the basic accounting reports.
But here’s what the simple cost reporting was hiding:
Every time a customer ordered a custom salad or a build-your-own burger, it required:
- More ingredients to stock and manage
- Longer preparation time
- More staff training
- More kitchen equipment
- Slower drive-through lines (which hurt every customer, not just that one)
That last point is huge. A slower drive-through doesn’t just affect the salad, it affects every single burger, fry, and Happy Meal behind it.
What ABC Would Have Revealed
If McDonald’s had fully traced the activities those complex menu items were driving (extra prep time, inventory complexity, slower service speed, staff confusion) the true cost of that salad would have looked a lot less attractive.
The simple items like fries, Big Macs, and sodas were carrying indirect costs from the complex items without anyone fully realizing it.
What Actually Happened
McDonald’s eventually slashed their menu significantly. They called it a focus on “simplicity and speed.” Franchisee profits went up, drive-through times got faster, and customer satisfaction improved.
They were essentially doing what ABC teaches: realizing that complex products consume far more resources than they appear to on a basic report, and that sometimes your “profitable” product is secretly cannibalizing your whole operation.
The one-line lesson
McDonald’s thought the salad was making them money. The salad was actually slowing down the thing that really made them money: fast, simple, high-volume burgers and fries.
That’s the power of understanding where costs actually come from.
Financial Statements
Financial accountants prepare three basic financial statements to show the condition and performance of the business – the balance sheet, income statement, and statement of cash flows. Provide external stakeholders with a view of an organization’s financial condition. Large corporations that publicly trade their stocks must publish an annual report with all three of these statements.
The Balance Sheet
A financial statement that reports the financial position of a firm by identifying and reporting the value of the firm’s assets, liabilities, and owners’ equity is the balance sheet. A balance sheet is basically a financial snapshot of a business at one specific moment in time. It answers one question:
“What does this business own, what does it owe, and what’s left over?”
They categorize assets (resources owned by the firm) into current assets (property, plant, and equipment) and intangible assets (brand, identity, intellectual property).
According to the accounting equation, the value of a firm’s assets must equal the sum of the amount of financing provided by owners and financing provided by creditors. In plain English: Everything you own (total assets) = Everything you owe (total liabilities) + What’s actually yours (owner’s equity)
The Three Parts
Assets — everything the business has (cash, equipment, inventory, buildings)
Liabilities — everything the business owes (loans, accounts payable, accrued expenses)
Owner’s Equity — the owner’s investment in the business
Example: Sam’s Sneaker Shop
| ASSETS | LIABILITIES | ||
| Cash | $5,000 | Bank Loan | $8,000 |
| Inventory (shoes) | $10,000 | Accounts Payable | $2,000 |
| Store Equipment | $5,000 | Total Liabilities | $10,000 |
| Total Assets | $20,000 | Owner’s Equity | $10,000 |
Notice that $20,000 = $10,000 + $10,000. The two sides always balance out, which is exactly why it’s called a balance sheet.
Think of it like this: if Sam’s Sneaker Shop closed today, sold everything it owns ($20,000), and paid off all its debts ($10,000), Sam would walk away with $10,000. That’s his equity.
The Income Statement
The financial statement that reports revenues, expenses, and net income resulting from a firm’s operations over an accounting period is the income statement. Where a balance sheet is a snapshot, an income statement is more like a highlight reel — it covers a period of time (a month, quarter, or year) and answers one question:
“Did this business actually make money?”
It’s built on one simple equation:
Revenue – Expenses = Net Income (Profit or Loss)
In plain English: Money coming in – Money going out = What you actually made
The Three Parts
- Revenue — all the money the business earned from selling products or services, and potentially other income flows (ex: rental income)
- Expenses — all the costs to run the business (rent, salaries, supplies, etc.)
- Net Income — what’s left over. If it’s positive, you made a profit. If it’s negative, you took a loss.
Example: Sam’s Sneaker Shop (January)
| REVENUE | |||||
| Sneaker Sales | $20,000 | ||||
| Total Revenue | $20,000 | ||||
| EXPENSES | |||||
| Cost of goods sold | $10,000 | ||||
| Rent | $2,000 | ||||
| Employee Wages | $3,000 | ||||
| Utilities | $500 | ||||
| Total Expenses | $15,500 | ||||
| Net Income (Profit) | $4,500 | ||||
Sam brought in $20,000 but spent $15,500 keeping the shop running, so he walked away with $4,500 in profit for January.
Balance Sheet vs. Income Statement — What’s the Difference?
Think of it this way: the income statement tells you how the game went. The balance sheet tells you where you stand after the game.
You need both to get the full picture of a business’s financial health.
Statement of Cash Flows
The financial statement that identifies a firm’s sources and uses of cash in a given accounting period is the statement of cash flows. If the income statement tells you whether you made money, the statement of cash flows tells you whether you actually have money. They sound the same, but they’re not.
“Where did our cash come from, and where did it go?”
Wait, Isn’t That the Same as Profit?
Not exactly — and this trips a lot of people up.
A business can be profitable on paper but still run out of cash. For example, Sam sells $10,000 worth of sneakers to a school on credit. That counts as revenue on the income statement. But if the school hasn’t paid yet, Sam doesn’t actually have that cash in hand. Bills still need to get paid though.
That’s why the cash flow statement exists — it tracks real cash moving in and out.
The Three Parts
- Operating Activities — cash from the everyday business of selling products or services
- Investing Activities — cash spent on or earned from long term assets (like buying equipment or a building)
- Financing Activities — cash exchanged with lenders or owners (like taking out a loan or paying it back)
Simple Example: Sam’s Sneaker Shop (January)
| OPERATING ACTIVITIES | |||||||
| Cash collected from customers | $18,000 | ||||||
| Cash paid for inventory | ($8,000) | ||||||
| Cash paid for rent | ($2,000) | ||||||
| Cash paid for wages | ($3,000) | ||||||
| Cash paid for utilities | ($500) | ||||||
| Net Cash from Operations | $4,500 | ||||||
| INVESTING ACTIVITIES | |||||||
| Purchased new display shelving | ($2,000) | ||||||
| Net Cash from Investing | ($2,000) | ||||||
| FINANCING ACTIVITIES | |||||||
| Loan payment to bank | ($500) | ||||||
| Net Cash from Financing | ($500) | ||||||
| Net Change in Cash | $2,000 | ||||||
| Cash at Start of January | $3,000 | ||||||
| Cash at End of January | $5,000 | ||||||
Are you happy with the cash flow trends as seen in this statement?
Key Takeaway
The Big Three, Side by Side
| Statement | Answers | Covers |
| Balance Sheet | What do we own and owe? | One moment in time |
| Income Statement | Did we make a profit? | A period of time |
| Cash Flow Statement | Do we actually have cash? | A period of time |
Together, these three statements give anyone a complete picture of a business’s financial health. Think of them as three different camera angles on the same game.
Other Statements
In addition to the three major financial statements discussed earlier, firms might prepare additional statements described below:
A statement of retained earnings shows how retained earnings have changed from one accounting period to the next. It answers one question:
“How much profit has the business kept over time?”
When a business makes a profit, the owner has two choices: take the money out (called a dividend or draw) or leave it in the business to help it grow. The money left in the business is called retained earnings. The statement of retained earnings tracks exactly that.
The owners’ equity statement shows how net income and dividends affect retained earnings. It also shows changes in common and/or preferred stock, such as the impact from the issuance of additional shares of stock. (For example, stock can be bought back). Think of this as the “retained earnings statement’s bigger sibling.” It covers the same idea but for companies that have multiple owners through stock rather than just one owner.
“How has the ownership value of this company changed over time?”
When a company sells stock, people buy small pieces of ownership called shares. Stockholders’ equity is the total value belonging to all those shareholders combined. It goes up when the company makes money or sells more stock, and it goes down when it loses money or pays out dividends.
The ending total equity from this statement flows directly onto the balance sheet under the equity section. It’s the final piece that ties everything together.
Comparative Statement Analysis is a way to use a company’s past performance to see how healthy they are today and where they might be going tomorrow.
Imagine you’re looking at your grades at the end of the year. Seeing a “B” in Math is okay, but it doesn’t tell the whole story. However, if you look at your grade from last semester (a “C”) and compare it to this semester (a “B”), you can see you’re getting better!
Comparative Statement Analysis is basically a report card for a business. Instead of looking at a company’s numbers for just one year, you line them up side-by-side for two or more years. By looking at the numbers next to each other, you can see if the company is growing, staying the same, or headed for trouble.
Business owners look at two main things:
-
The Dollar Change: How much more (or less) money did we make this year compared to last year?
-
The Percentage Change: What was the “speed” of that change? For example, making $1,000 more is great if you’re a lemonade stand (huge growth!), but it’s tiny if you’re Apple.
This analysis is helpful to spot trends (Is the company making more money every single year, or is it starting to drop?), check expenses (Are we spending way more on electricity this year? Why?) and predict the future (If a business has grown by 10% every year for five years, it’s a good bet they might do it again next year).
Ratio Analysis is another way to look at a business “report card,” but instead of just comparing years, you are comparing different numbers to each other to see how they relate.
Think of it like batting averages in baseball or fuel efficiency (MPG) in a car. A single number doesn’t tell you much, but when you compare two numbers (like hits vs. at-bats), you get a clear picture of how things are going.
How it Works: In business, you take two numbers from a financial report and divide one by the other. This gives you a ratio.
Here are the three most common things people look for:
- Can we pay our bills? (Liquidity): This compares the cash you have right now to the bills you owe soon. It’s like checking if you have enough money in your pocket to buy lunch today.
2. Are we making a profit? (Profitability): This compares how much money you kept versus how much you sold. If you sold $100 worth of lemonade but spent $90 on lemons and sugar, your profit ratio is pretty low.
3. Are we using our stuff well? (Efficiency): This looks at how fast you sell your products. If you own a clothing store, you want your clothes to sell quickly so they don’t just sit on the shelves getting dusty.
Why is this useful?
Ratios make it easy to compare totally different companies.
Imagine a massive pizza chain and a tiny local pizza shop. You can’t compare their total dollars because the big chain will always have more. But, you can compare their Profit Margin percentage. If the small shop keeps 20% of every dollar and the big chain only keeps 10%, the small shop is actually doing a better job of managing its money!
Key Takeaway
The Full Picture: Financial Statements
| Statement | Answers |
| Balance Sheet | What do we own and owe? |
| Income Statement | Did we make a profit? |
| Cash Flow Statement | Do we actually have cash? What is happening to cash? |
| Retained Earnings Statement | How much profit did we keep? |
| Owners’ Equity Statement
Comparative Statement Analysis
Ratio Analysis |
How has total ownership value changed? (including the impact of profits, distributions, owner investments, and changes in common / preferred stock)
When comparing this year to last, how much money did we make/loose (and at what speed)?
Can we pay our bills? Are we making a profit? Are we efficient? |
Each one tells a different part of the same story.
The Independent Auditor’s Report
A company’s financial statements need to be put into context. An independent auditor is a certified outside accountant (a CPA firm) that has no connection to the company. They come in, dig through the books, and give an honest opinion on whether the financial statements are accurate.
U.S. securities laws require publicly traded corporations in the United States to have an independent CPA firm perform an annual external audit of their financial statements. It’s like a seal of approval from an outside expert. For CPA firms to perform audits with integrity, they must be independent of the firms they audit.
Verifies that financial statements:
- Are prepared in accordance with generally accepted accounting principles
- Fairly present the firm’s financial condition
- Included in the annual report that a firm sends its stockholders
Most auditor reports issue one of three opinions:
| Opinion | What It Means |
| Clean (Unqualified) | “Everything looks good. The statements are fair and accurate.” |
| Qualified | “Mostly fine, but there’s one specific issue we need to flag.” |
| Adverse | “These statements are NOT accurate. Do not trust them.” |
The vast majority of reports are clean opinions. Qualified opinions state that the financial condition of a company is still presented fairly. If a company receives an adverse opinion, that’s a massive red flag for investors.
Why Should You Care?
Remember the Enron scandal from earlier? Arthur Andersen was supposed to be playing this exact role: the independent outside firm keeping Enron honest. Instead, they looked the other way and helped cover things up.
That’s why auditor independence is taken so seriously today. The whole system only works if the auditor genuinely has nothing to gain by lying.
Budgeting
A budget is a management game plan. It lays out how a company expects to get the money it needs and how it plans to spend it over a specific period of time. More than just numbers, a budget forces managers to get specific:
“What exactly are our goals, and what resources do we need to actually achieve them?”
Why Bother Budgeting?
A good budget does four things for a business:
- Plans ahead — turns big goals into concrete numbers and action steps
- Gets everyone on the same page — encourages communication between managers and employees
- Motivates people — gives teams clear targets to work toward
- Measures progress — lets managers see what’s working and what isn’t
Two Ways to Build a Budget
- Top-Down Budgeting — upper management creates the budget and hands it down. Fast, but employees may feel left out of the process.
- Bottom-Up (Participatory) Budgeting — managers and employees at all levels contribute to building the budget. Takes longer, but tends to produce more realistic numbers and better buy-in from the team. This is the more common approach.
Church Budget Example on Sheet 3
The Master Budget
A presentation of an organization’s operational and financial budgets is called the master budget. Think of it as the complete financial roadmap for the business: every department, every dollar, all in one place. If the independent auditor’s report is the “seal of approval” on past performance, the master budget is the blueprint for future performance.
Do you want to make this a career?
Don’t want to make this a career?
EXTRA LEARNING RESOURCES