Chapter 1.0: Introduction
Ch. 1.1: Background Facts and Figures
What Are Psychoactive Substances?
Psychoactive substances are chemicals affecting how the brain functions, and thus have the power to affect a person’s mind, mood, and behavior when consumed. The word psychotropic means the same thing. Many of these substances have important medicinal or other positive purposes when used appropriately. Many also are the subject of concern because of the consequences arising from their misuse and the potential for their use evolving into a substance use disorder. The wide range of psychoactive substances examined in this course include:
- alcohol,
- sedative/hypnotic and central nervous system (CNS) depressants,
- cannabis and other hallucinogenic/dissociative drugs,
- stimulants (including amphetamines, methamphetamine, cocaine, nicotine, and caffeine),
- opioids, inhalants, steroids, commonly misused over-the-counter substances, as well as prescription drug misuse.
Epidemiological Studies. Epidemiology means to study the distribution and causes of disease. Several large-scale epidemiological studies are routinely relied on to answer questions concerning prevalence and incidence rates and trends in the United States and around the world, as well as other social indicators. These include:
- the National Survey on Drug Use and Health (NSDUH) with regular reports from the Substance Abuse and Mental Health Services Administration (SAMHSA);
- the National Epidemiological Survey on Alcohol and Related Conditions (NESARC) with three waves of data (Wave I from 2001-2002, Wave II from 2004-2005, Wave III from 2012-2103);
- the annual Monitoring the Future Study of 8th, 10th, and 12th grade students in the U.S., which also has some longitudinal follow-up data for some participants into early adulthood;
- the United Nations Office on Drugs and Crime (UNODC) which compiles data from global sources, including the World Health Organization (WHO)into an annual World Drug Report.
Scope of the Issue.
The World Drug Report 2019 (WHO, 2019) reported that not only are the adverse health consequences of drug use more severe and widespread than previously believed, the severity of the situation is increasing.
- An estimated 35 million individuals globally experienced drug use disorders requiring treatment services and an estimated 271 million (5.5% of the world’s population) used drugs outside of medical recommendation during 2017.
- Only 1 in 7 persons in need of treatment for a drug use disorder receives it.
- There was a 25% increase in production of cocaine compared to the previous year, reaching an all-time high.
- There were 47,000 opioid overdose deaths reported in the United States during 2017 (up 13% from 2016) and 4,000 in Canada (up 33% from the previous year). An opioid crisis is also arising in West, Central, and North Africa although the specific opioid drugs involved may differ in various parts of the world.
In the U.S., based on the 2017 NSDUH data,
- An estimated 134.7 million individuals over the age of 12 (49.5% of population) used illicit drugs (including prescription drugs outside of medically prescribed use) during their lifetimes (SAMHSA, 2018).
- Almost 30.5 million (11.2% of population) were estimated to have used illicit drugs in the past month (i.e. “current use”).
- Over 19.7 million individuals aged 12 or older (7.2% of population) were estimated to experience a substance use disorder (SUD) involving alcohol and/or and illicit drug use during the past year.
- The vast majority of SUDs involved alcohol alone (5.3%) or in combination (0.9%) with illicit drugs, leaving 1% with a drugs only SUD.
Just over 4 million individuals (1.5% of population) received substance use treatment during that time (SAMHSA, 2018). Over 17 million individuals needing treatment based on SUD criteria did not feel a need for treatment.
NSDUH data also reveals the differences between types of substances used and who engages in alcohol or other drug (AOD) use/misuse in the U.S. by age, gender, and racial/ethnic group. Despite the emphasis on certain substances in the news and stereotypes stemming from various sources, the answers to these kinds of “what” and “who” questions are informative, and some answers my surprise you.
Type of Substance: Alcohol.
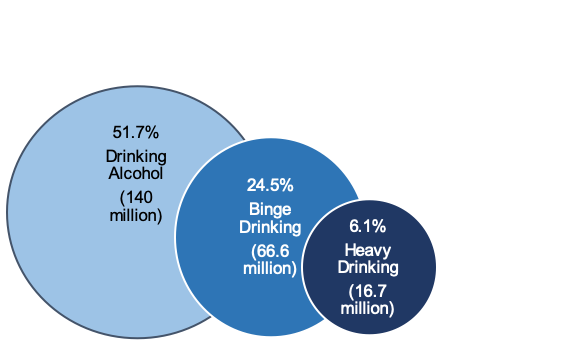
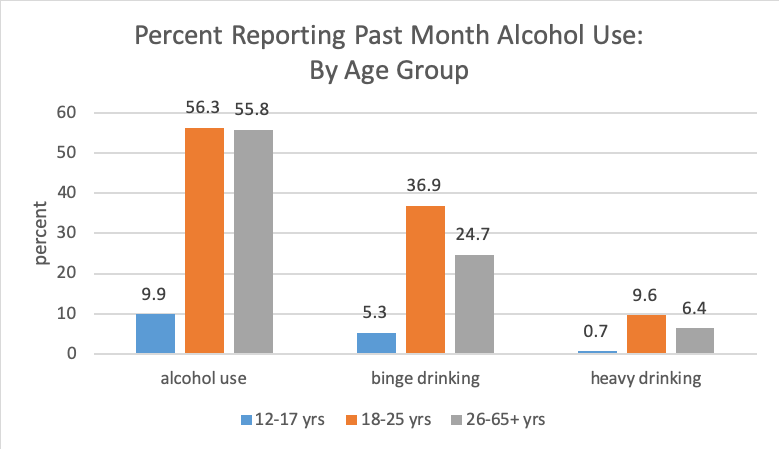
What is the most commonly used substance? In the U.S., alcohol. Not illicit drugs like marijuana and heroin and not prescription drug misuse. According to estimates based on the NSDUH data for 2017, more than 140 million individuals (51.7% of population) over the age of 12 used alcohol during the past month—meaning they are considered to be currently using alcohol (SAMHSA, 2018). Not all alcohol consumption occurred in risky or problematic amounts, however—the vast majority of individuals who consume alcohol do so in moderation. This is in contrast to individuals engaging in binge drinkingor heavy drinkingpatterns (see Figure 1.1). Binge alcohol use in the past month, defined as “five or more drinks (for males) or four or more drinks (for females) on the same occasion (i.e., at the same time or within a couple of hours of each other),” was attributed to 66.6 million individuals (24.5% of population); heavy alcohol use, defined as “binge drinking on the same occasion on each of 5 or more days in the past 30 days; all heavy alcohol users are also binge alcohol users”, to 16.7 million (6.1% of population) [SAMHSA, 2018, Tables 2.20A & 2.20B].
Figure 1.1. Percent reporting past-month drinking alcohol, binge drinking, and heavy drinking (derived from SAMHSA, 2018 report for persons aged 12+)
You may wonder about the difference in amounts for men and women presented in the binge drinking definition. According to the National Institute on Alcohol Abuse and Alcoholism (NIAAA), drinking in a manner that raises a person’s blood alcohol concentration (BAC) to 0.08g/dL or higher is binge drinking. Amounts and rates of alcohol consumption will be factors in this outcome, along with aspects of individual differences in constitution. In general, for women this means about four drinks in about two hours or five drinks in two hours for men. This pattern sometimes is referred to as risky single occasion drinking (RSOD).
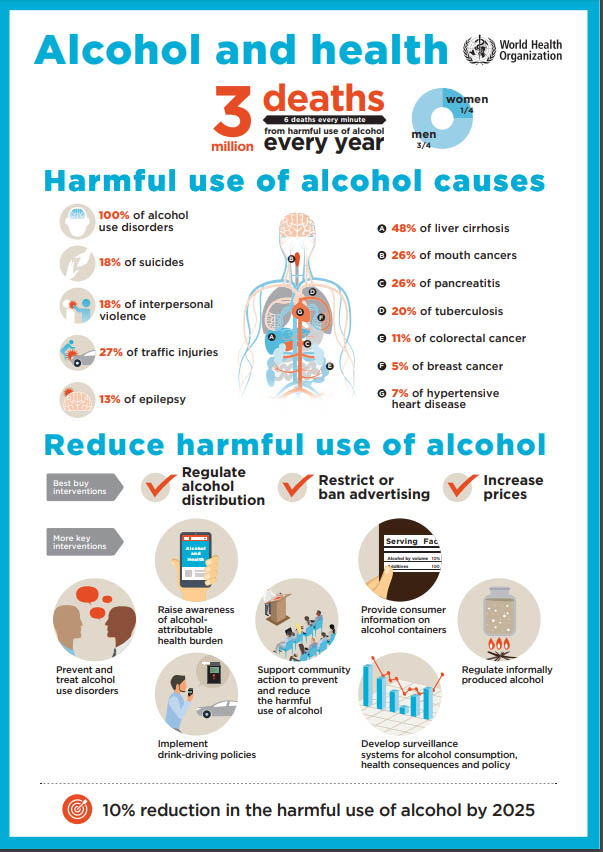
The World Health Organization (WHO, 2014) identified alcohol as a significant factor in the global burden of disease (and death). The harmful use of alcoholwas defined as: “drinking that causes detrimental health and social consequences for the drinker, the people around the drinker and society at large, as well as the patterns of drinking that are associated with increased risk for adverse health outcomes” (p. 2). Thus, WHO set a goal for a 10% reduction in harmful use of alcohol by the year 2025 around the world because of the many health consequences (and 3 million deaths per year) attributed to this behavior (see Figure 1.2). Reducing and preventing alcohol-related harm is also one of the American Academy of Social Work and Social Welfare (AASWSW) Grand Challenges for Social Work under the umbrella goal called “Close the Health Gap” (Begun, Clapp, and the Alcohol Misuse Grand Challenge Collective, 2015).
Figure 1.2. Infographic produced by WHO (retrieved from https://www.who.int/images/default-source/departments/substances-abuse/alcohol/infographics/alcohol-3-million-death-every-year.png?sfvrsn=8062967_2)
Type of Substance: Other Drugs.
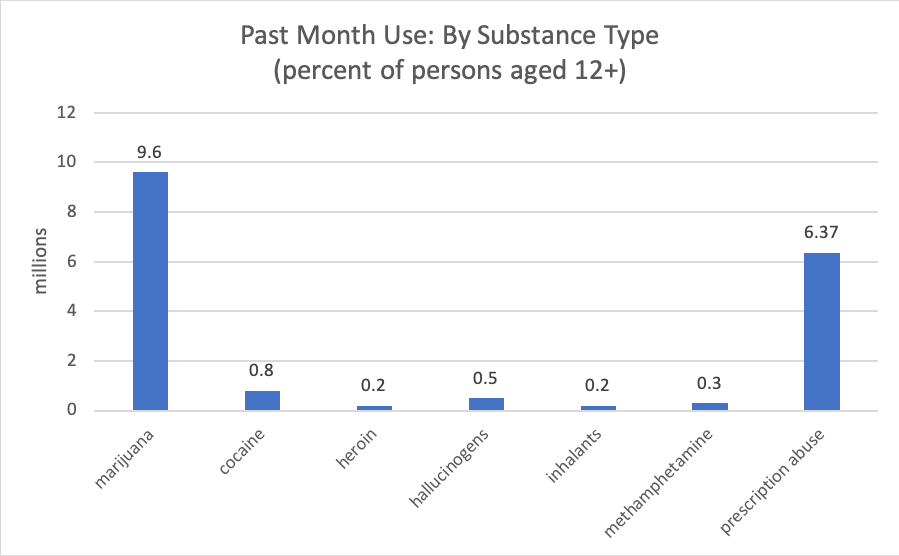
We looked at data concerning alcohol in the AOD acronym, now let’s take a look at those other drugs. Over 30 million individuals (11.2% of the population) were estimated to have used illicit drugs in the past month based on 2017 NSDUH data (SAMHSA, 2018).
- The type of illicit drug most often used in the U.S., by far, was marijuana—an estimated almost 26 million individuals over the age of 12.
- The next most common was the misuse of prescription psychoactive drugs, including pain relievers, stimulants, tranquilizers, and sedatives, in that order of frequency (an estimated almost 6 million individuals combined).
- Less commonly used were cocaine, hallucinogens, heroin, and methamphetamine (see Figure 1.3). Note that the percentages in Figure 1.3 add up to more than the 11.2% of the population using illicit drugs; this is because some individuals used more than one type.
Comparing these percentages with what you just learned about alcohol, were you surprised that so much greater emphasis seems to be placed on drug problems than alcohol? You may find it curious that the FY 2016 National Institute on Drug Abuse (NIDA)budget for research and development was almost double the National Institute on Alcohol Abuse and Alcoholism (NIAAA) research and development budget; NIDA and NIAAA are two parts of the U.S. National Institutes of Health (NIH)(seehttps://officeofbudget.od.nih.gov/pdfs/FY18/Drug%20Control%20Programs.pdf).
Figure 1.3. Past month use of various substances (SAMHSA, 2018)
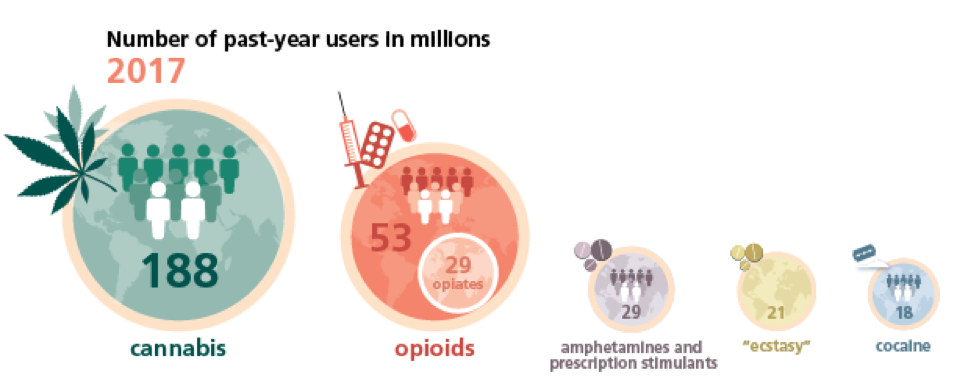
The World Drug Report 2019 contains a figure demonstrating the estimated global prevalence of drug use comparing cannabis, opioids, amphetamines/prescription stimulants, ecstasy, and cocaine. As in the U.S., cannabis is the drug most commonly used around the world (see Figure 1.4).
Figure 1.4. World Drug Report 2019 (UNODC, 2019) past-year use of five types of drug in 2017.
What about nicotine?
- Among persons aged 12 and older, based on the 2017 NSDUH data, an estimated 170.5 million individuals have used tobacco products (not including e-cigarettes/vaping) during their lifetimes—62.7% of the population.
- Current use was attributed to over 61 million, or 22.4% of the population (SAMHSA, 2018).
- The vast majority of use involved cigarettes; smokeless tobacco, cigars, and pipe tobacco were less common.
- According to the WHO (https://www.who.int/news-room/fact-sheets/detail/tobacco) tobacco kills more than 8 million people annually, 1.2 million of whom were non-smokers exposed to second-hand smoke; 1.1 billion individuals smoke tobacco worldwide; and, tobacco kills up to half its users.
- The report also refers to other victims of tobacco: children from poor families employed in tobacco farming absorb nicotine through their skin from handling tobacco leaves and are vulnerable to “green tobacco sickness” as a result. In addition to concluding that tobacco represents a significant U.S. and global public health concern, this information indicates that deciding to smoke is not just an individual choice matter—it has implications for others nearby (second-hand smoke exposure) and for others of whom we may be unaware (involved in production and distribution). These issues are not unique to tobacco, by the way—it is a relevant social justice consideration regarding all types of drugs.
Type of Substance by Age Group.
Based on the 2017 NSDUH data (SAMHSA, 2018), patterns of alcohol and illicit drug use can be estimated for each of the following age groups: 12 to 17-year-olds (youth), 18 to 25-year-olds (emerging adults), 26 to 64-year-olds (adults), and individuals aged 65 and older.
- Alcohol is an illicit substance for underage youths (those aged 12-17 and many in the survey’s 18-25 group).
- Figure 1.5 shows the percent reporting past month use of alcohol, binge drinking, and heavy drinking by age group in the 2017 NSDUH data.
- These numbers all peaked for our emerging adult group. While the alcohol use percentage remained relatively steady into adulthood (over age 25), binge and heavy drinking percentages declined.
- These data indicate that the majority of adults who drink generally do so in moderation.
- However, more than half of individuals in emerging adulthood and adolescence who used alcohol in the past month engaged in binge drinking (considered a risky pattern); slightly less than half of adults did so.
- About 18% of emerging adults engaged in the riskiest pattern, heavy drinking, compared to about 11% of adults and about 8% of adolescents (SAMHSA, 2018).
Figure 1.5. Patterns of past month alcohol use by age group.
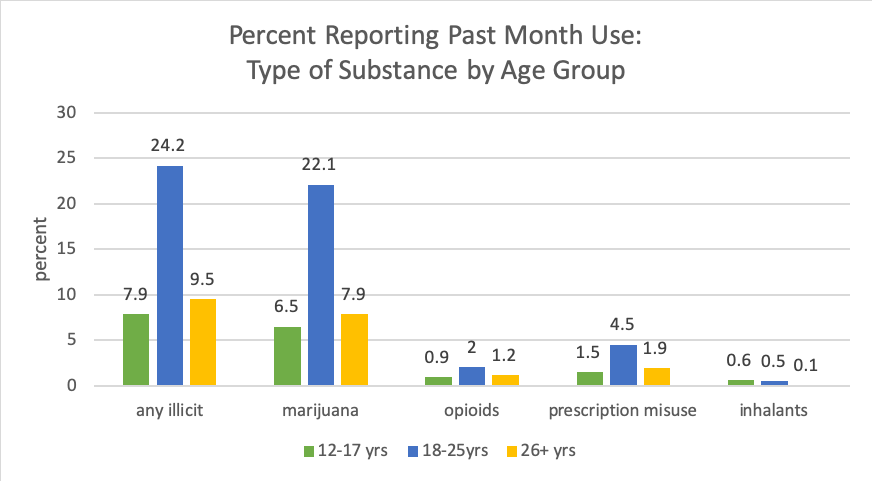
- Past month use of most illicit drugs was highest among the emerging adulthood group (aged 18-25 years) and declined in percentage after age 26 (see Figure 1.6).
- The exception was inhalant misuse: this was most common among adolescents, dropped a bit in emerging adulthood, and continued to drop in adulthood.
- Marijuana was the most illicit substance most frequently used; opioids included heroin use and pain reliever misuse.
Figure 1.6. Patterns of past month illicit drug use by age group.
Finally, let’s consider tobacco use by age group.
- Adolescents’ (aged 12-17 years) past month use of tobacco products is on the rise due to electronic cigarettes.
- 20.8% of 9-12 graders used electronic cigarettes in the past month, while only 3.2% of adults used electronic cigarettes in the past month (https://www.cdc.gov/nchs/data/hus/hus18.pdf).
- 13.8 % of adults smoke cigarettes, compared to 8.1% of high schoolers (https://www.cdc.gov/nchs/fastats/smoking.htm).
Substance Use by Gender:
Illicit drug and tobacco use were more common among men than women aged 12 and older; alcohol use patterns were very similar among men and women (see Figure 1.7).
Figure 1.7. Past month alcohol, illicit drug, and tobacco use by gender for persons aged 12+ years
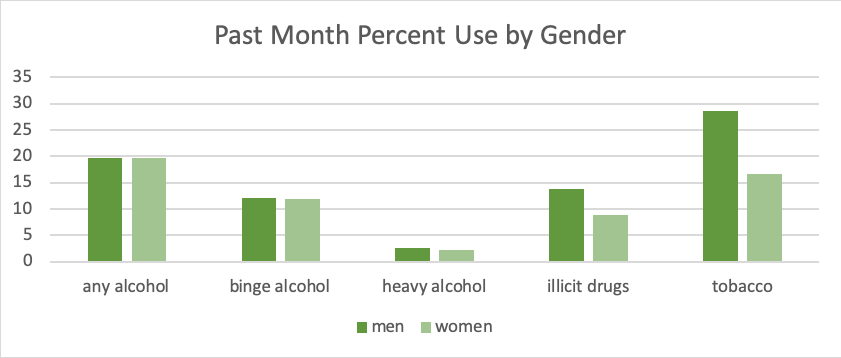
Of considerable concern is evidence that, despite concentrated public health efforts, about 10% of women worldwide consume alcohol while pregnant (Popova, Rehm, & Shield, in press): prenatal alcohol exposure (PAE) potentially has lifelong effects on a person’s health, mental health, and abilities.
Type of Substance by Race/Ethnicity.
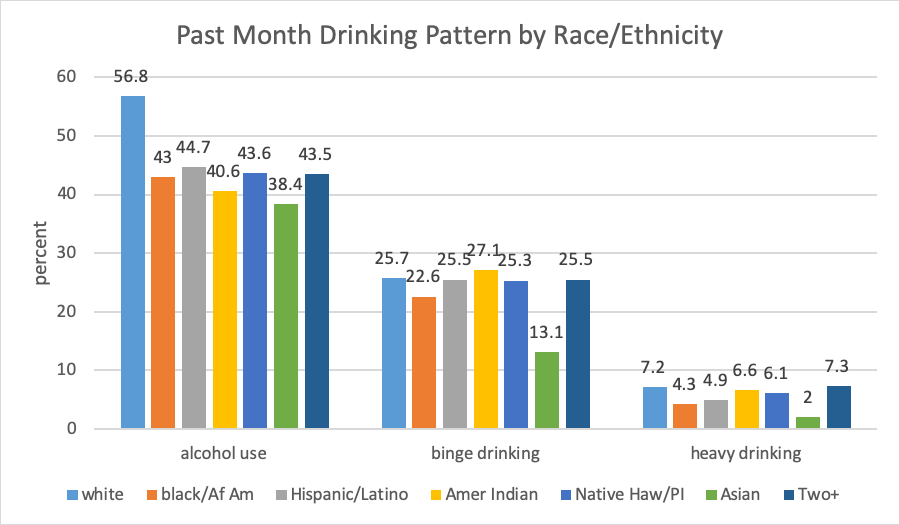
The seven U.S. racial/ethnic groups for whom information is reported in the 2017 NSDUH survey (SAMHSA, 2018 include: white; black/African American; Hispanic/Latino; Asian; American Indian/Native Alaskan; Native Hawaiian/Other Pacific Islander; and, those of two or more races.
Alcohol.
- The group most likely to report past month use of alcohol was comprised of individuals who identified themselves as white (56.%) and the lowest rates were reported by the group identifying as Asian (38.4%) groups (see Figure 1.8).
- Looking at these statistics another way, the highest rates of alcohol abstinence (individuals not drinking) in the past month appeared among the Native Hawaiian/Other Pacific Islander, American Indian, and African American groups.
The picture differs somewhat when looking at binge and heavy drinking patterns.
- Individuals identifying as white remained in the top range of those who engaged in binge drinking during the past month (25.3-27.1) which also included individuals identifying as Hispanic/Latino, American Indian, Native Hawaiian/Pacific Islander, or belonging to two or more groups.
- Individuals who self-identified as Asian had the lowest rate of binge drinking (13.1%), with a rate in between these extremes reported in the African American group (22.6%).
- Heavy drinking was at the highest rate among white individuals and those belonging to two or more groups (7.2-7.3%), lowest among the Asian group (2%) and somewhere between 4.3-6.6% for the other groups.
Figure 1.8. Past month drinking patterns reported by race/ethnicity
Other drugs.
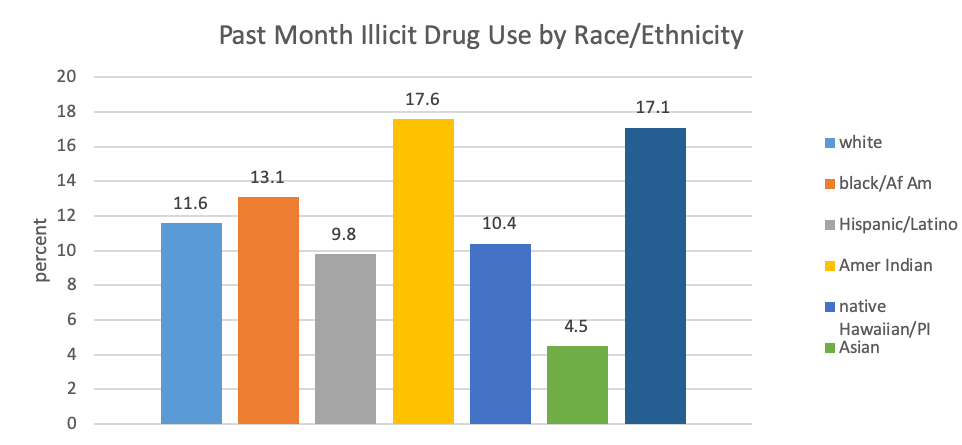
- The groups reporting the highest rate of past month illicit drug use were those who self-identified as American Indian and as belonging to two or more races (17.6% and 17.1%, respectively; see Figure 1.9).
- The lowest rate was reported among those identifying as Asian (4.5%) with the other groups falling in between (9.8% to 13.1%). As you can see, this picture differs somewhat from the story presented by the alcohol data.
Figure 1.9. Past month illicit substance use by race/ethnicity
