Chapter 2. Strategy, Objectives, and Project Selection
2.4 Project Selection Process
When selecting a project, both quantitative and qualitative analysis is useful in order to arrive at projects which have the greatest potential impact. Generally, more complex projects involve a greater amount of risk. They also require a longer implementation and business benefits realization period. Therefore, project selection decisions will weigh the benefits offered with the timeframe required to realize these benefits. Organizations will often consider the payback period, which refers to the amount of time it takes to recover the cost of an investment. Projects that offer significant benefits, and that can be realized in a relatively short time, are more likely to be approved. However, this is only one of the methods to evaluate if a project is favorable compared with other projects.[1]
In Chapter 1, we started evaluating the uniqueness and temporary nature of a project through which our grocery market chain, Grocery LLC, aimed at establishing self-checkout areas at all fifty markets across five states to solve the problem of more than usual traffic between 4 pm and 7 pm during the weekdays. Assume that we had two solution candidates for this problem. One is the self-checkout area to be established at all fifty stores (See Chapter 1, Case Study 1.1). Let’s name the “establishment of self-checkout areas” project as “Project B”. We also wanted to evaluate another solution through which we can increase the number of checkout stations where our cashiers work. This solution is named Project A.
Table 2.1 provides cash inflows and outflows of two candidate projects assuming that both project deliverables have a lifetime of five years. As can be seen in Table 2.1, the payback period for Project A would be three years, which means that our organization can recover the cost ($100,000) of this project’s investment in three years.
-100,000 (year 0) + 30,000 (year 1) + 40,000 (year 2) + 30,000 (year 3) = 0
| Project A | Project B | |
| (Traditional checkout stations) | (Self-checkout areas) | |
| Year 0 | ($100,000) | ($200,000) |
| Year 1 | $30,000 | $15,000 |
| Year 2 | $40,000 | $50,000 |
| Year 3 | $30,000 | $75,000 |
| Year 4 | $10,000 | $105,000 |
| Year 5 | $10,000 | $75,000 |
For Project B, the payback period would be 3.57 years (3 years + 60,000/105,000). As can be seen in Table 2.2, when we finished the third year, the net cash flow was still negative (-200,000 + (15,000 + 50,000 + 75,000) = – 60.000). Therefore, the breakeven point would be after the fourth year. Because Project A’s payback period (3 years) is shorter than Project B’s (3.57 years), we can prefer Project A over Project B only taking into account the payback period.
| Project A | Net Cash Flow | Project B | Net Cash Flow | |
| Year 0 | ($100,000) | ($100,000) | ($200,000) | ($200,000) |
| Year 1 | $30,000 | ($70,000) | $15,000 | ($185,000) |
| Year 2 | $40,000 | ($30,000) | $50,000 | ($135,000) |
| Year 3 | $30,000 | $0 | $75,000 | ($60,000) |
| Year 4 | $10,000 | $10,000 | $105,000 | $45,000 |
| Year 5 | $10,000 | $20,000 | $75,000 | $120,000 |
However, this financial method ignores a crucial factor that may affect the real value of our cash inflows, which is the time value of the money, that is affected by two main annual rates: (1) Inflation rate (pt), and (2) required rate of return (r). Therefore, the discount factor needs to be incorporated into the computation to have real values.
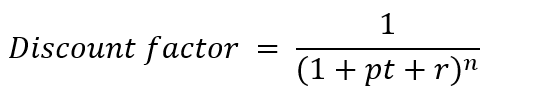
In our example above, let’s take pt 0.02, and r 0.08. Our organization expects to earn a minimum of 0.08 annually on average when we invest. This can also be considered as the opportunity cost.
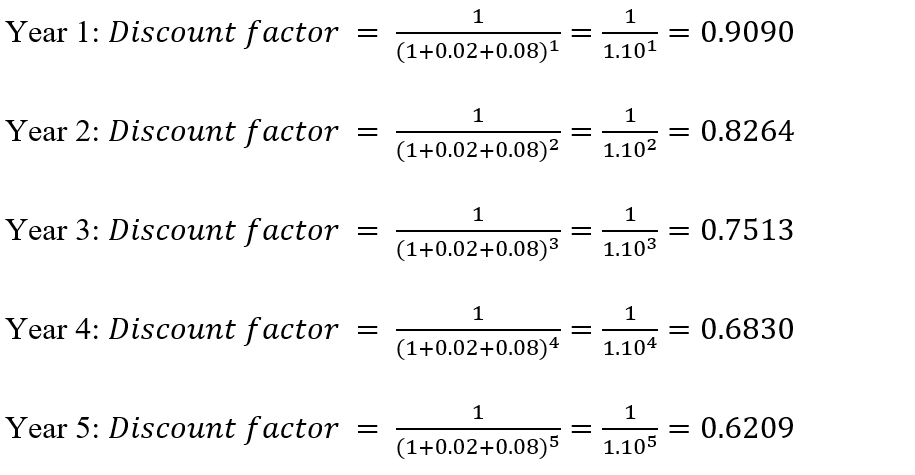
For each year, we should multiply the discount factor by each cash inflow to find the real value.
| Project A | Today’s Value | Net Cash Flow | Project B | Today’s Value | Net Cash Flow | |
| Year 0 | ($100,000) | ($100,000) | ($100,000) | ($200,000) | ($200,000) | ($200,000) |
| Year 1 | $30,000 | $27,273 | ($72,727) | $15,000 | $13,636 | ($186,364) |
| Year 2 | $40,000 | $33,058 | ($39,669) | $50,000 | $41,322 | ($145,041) |
| Year 3 | $30,000 | $22,539 | ($17,130) | $75,000 | $56,349 | ($88,693) |
| Year 4 | $10,000 | $6,830 | ($10,300) | $105,000 | $71,716 | ($16,976) |
| Year 5 | $10,000 | $6,209 | ($4,091) | $75,000 | $46,569 | $29,593 |
As can be seen in Table 2.3, the payback period changed for both projects. The payback period for Project A cannot be attained in five years, which means that our organization cannot recover the cost ($100,000) of this project’s investment even in five years. For Project B, it would be 4.36 years (4 years + 16,976/46,569). Eventually, after taking into account the time value of the money, we can choose Project B over Project A on the contrary of our first decision without the discount factor.
NPV (Net Present Value) is another way of showing the long-term profitability of a project. At the end of the expected lifetime of a project outcome, NPV indicates the profit (Earnings – Project investment costs). As seen in Table 2.4, NPV is negative for Project A while it is positive for Project B. Therefore, we can select B over A.
| Project A | Today’s Value | Project B | Today’s Value | |
| Year 0 | ($100,000) | ($100,000) | ($200,000) | ($200,000) |
| Year 1 | $30,000 | $27,273 | $15,000 | $13,636 |
| Year 2 | $40,000 | $33,058 | $50,000 | $41,322 |
| Year 3 | $30,000 | $22,539 | $75,000 | $56,349 |
| Year 4 | $10,000 | $6,830 | $105,000 | $71,716 |
| Year 5 | $10,000 | $6,209 | $75,000 | $46,569 |
| NPV | ($4,091) | $29,593 |
Financial models such as payback period and NPV consider solely the financial indicators. Since little may be known about the specific solution at the time of project selection, financial evaluations are based on high-level estimates only. However, organizations need to consider other qualitative factors such as competitive advantage, future market potential, risk, legal and regulatory issues, and safety. Therefore, many organizations utilize project selection models where they can include criteria prioritized for the organization in general, and the projects and their affiliated programs and portfolios. In this chapter, we will discuss only one of the models commonly used by organizations, which is the weighted scoring model.
Non-financial reasons for selecting projects are often viewed as strategic considerations; they include everything from ending a dependency on an unreliable vendor to restoring the image of an organization. Once a project is selected, a more detailed financial analysis is often performed. Since decision-making models often consider numerous criteria when evaluating the change alternatives, tools such as the weighted scoring model are very helpful. Weighted scoring models introduce objectivity in what would otherwise be a very subjective decision-making process. A weighted scoring model allows decision-makers to structure the decision-making process by specifying and prioritizing needs by identifying decision-making criteria; evaluating, rating, and comparing different alternatives; and selecting the best matching solution.
Creating a weighted scoring model starts with careful consideration of decision-making criteria. In the case of project selection, many organizations refer to their strategic plans to identify important factors. These criteria are often a mix of financial and non-financial criteria. Once the criteria have been selected, we give each criterion a value, called a weight, in order to illustrate its relative importance. The more important the criterion, the higher its weight. Each of the potential change initiatives (e.g., business cases) is evaluated against the weighted criteria and given a score for each criterion. These models can help us introduce more objectivity into our decision-making.
Let us continue with our grocery market chain’s project candidates. Thereafter, let us increase the number of projects to four. The project selection committee will evaluate these four potential projects based on six criteria. We have already discussed two projects’ NPVs. The committee had scheduled a meeting today to discuss these four projects (Table 2.5). Project A targets to increase the traditional checkout stations in all the markets if their layouts allow for an expansion inside the markets. Project B aims to designate areas for self-checkout stations. In this project, we will need to reduce the number of traditional checkout stations. Project C’s goal is to create new ads for television and social media (e.g.. YouTube, Facebook, Instagram). Finally, Project D aims to create a new mobile (smartphone and tablet) application and make the current website compliant with the smartphones.
The organizational constraints (time, budget, resources, risks) allow the selection of a maximum of two projects. They are using a weighted scoring model. There are six criteria as shown in Table 2.5. They are strategic opportunity, competitive advantage in IT, the potential for higher market share, profitability (NPV), sustainability, and risk aversion. As can be seen here, we are not focusing on only the profitability, but also other factors that bring about a holistic approach to evaluating the feasibility and benefits of projects. The committee members will score each criterion. A score of 1 represents unfavorable, 2 satisfactory, and 3 favorable.
Although weights are provided out of 100 percent, in order to make the computation easier to follow, they are typed in Table 2.5 as two-digit numbers instead of decimals. Therefore, the total weight must not exceed 100. These weights may be decided after brainstorming meetings with subject matter experts and stakeholders. The subjectivity of these criteria’s weights and points can be mitigated to some extent with the brainstorming activity. Most of the time, the organizations or the external client may impose the weights according to the organizational strategy and priorities.
| Projects | |||||
| Category | Weight | A | B | C | D |
| Strategic opportunity | 25 | 1 | 3 | 2 | 3 |
| Competitive advantage in IT | 15 | 1 | 3 | 1 | 3 |
| Potential for higher market share | 20 | 2 | 2 | 3 | 3 |
| Profitability (NPV) | 10 | ||||
| Sustainability | 10 | 3 | 2 | 1 | 1 |
| Risk aversion | 20 | 3 | 2 | 3 | 1 |
As you can see in Table 2.5, NPV is just one of the criteria that is used by the selection committee. The required rate of return is 0.08, and the inflation rate is 0.02. We have already computed the discount factors above. The committee should incorporate the NPV scores based on the estimated cash flows given in Table 2.6, and the decision table in Table 2.7.
| Project | Investment | Year 1 | Year 2 | Year 3 | Year 4 | Year 5 |
| A | -100,000.00 | 30,000.00 | 40,000.00 | 30,000.00 | 10,000.00 | 10,000.00 |
| B | -200,000.00 | 40,000.00 | 60,000.00 | 75,000.00 | 105,000.00 | 100,000.00 |
| C | -30,000.00 | 20,000.00 | 15,000.00 | 10,000.00 | 3,000.00 | 1,000.00 |
| D | -125,000.00 | 25,000.00 | 40,000.00 | 50,000.00 | 55,000.00 | 65,000.00 |
| NPV | SCORES |
| NPV < 0 | 1 |
| 0 ≤ NPV < 50,000 | 2 |
| 50,000 ≤ NPV | 3 |
NPVs for four projects are, respectively, (4,090.63); 76,107.57; 10,761.62; and 46,276.49. Therefore, NPV scores are 1, 3, 2, and 2 respectively.
| Projects | Weighted Scores | ||||||||
| Category | Weight | A | B | C | D | A | B | C | D |
| Strategic opportunity | 25 | 1 | 3 | 2 | 3 | 25 | 75 | 50 | 75 |
| Competitive advantage in IT | 15 | 1 | 3 | 1 | 3 | 15 | 45 | 15 | 45 |
| Potential for higher market share | 20 | 2 | 2 | 3 | 3 | 40 | 40 | 60 | 60 |
| Profitability (NPV) | 10 | 1 | 3 | 2 | 2 | 10 | 30 | 20 | 20 |
| Sustainability | 10 | 3 | 2 | 1 | 1 | 30 | 20 | 10 | 10 |
| Risk aversion | 20 | 3 | 2 | 3 | 1 | 60 | 40 | 60 | 20 |
| TOTAL SCORES | 100 | 180 | 250 | 215 | 230 | ||||
Based on the results, the selection committee should choose Project B (Self-checkout areas) since it has the highest score. Project D (M-commerce) has the second-highest total points (230 points). Since we can select two projects and initiate them, we can move forward for projects B and D. The project initiation will be discussed in Chapter 3. In that chapter and following chapters, we will focus on Project D.
However, it is always possible to modify the weights to favor another project. Therefore, this reminds us of the fact that these models are not free from subjectivity. For example, if we change the “strategic opportunity” weight from 15 to 10, the “competitive advantage in IT” weight from 25 to 10, the “profitability (NPV)” weight from 10 to 5, the “sustainability” weight from 10 to 25, and the “risk aversion” weight from 20 to 30, we can make Project A (Increasing the number of traditional checkout stations) the highest score. Hence, we can select Project A (Table 2.9). As can be seen in this example, this method is subject to substantial subjectivity.
| Projects | Weighted Scores | |||||||||
| Category | Old Weight | New Weight | A | B | C | D | A | B | C | D |
| Strategic opportunity | 15 | 10 | 1 | 3 | 2 | 3 | 10 | 30 | 20 | 30 |
| Competitive advantage in IT | 25 | 10 | 1 | 3 | 1 | 3 | 10 | 30 | 10 | 30 |
| Potential for higher market share | 20 | 20 | 2 | 2 | 3 | 3 | 40 | 40 | 60 | 60 |
| Profitability (NPV) | 10 | 5 | 1 | 3 | 2 | 2 | 5 | 15 | 10 | 10 |
| Sustainability | 10 | 25 | 3 | 2 | 1 | 1 | 75 | 50 | 25 | 25 |
| Risk aversion | 20 | 30 | 3 | 2 | 3 | 1 | 90 | 60 | 90 | 30 |
| TOTAL SCORES | 100 | 230 | 225 | 215 | 185 | |||||
Weighted scoring models are easier to use as they offer structurally simple models. These models allow organizations to prioritize criteria according to their strategic objectives and client expectations. Management can directly ask the committees to consider the weights they provide so that it can be a direct reflection of managerial policy. Additionally, the weights can be modified in order to accommodate any changes in management and program levels. One of the apparent drawbacks of these models is that they don’t allow a linear comparison among the projects. If a project gets 100 points, and another gets 200 points, it doesn’t necessarily mean that the second project is two times more important than the first project. Another drawback could emerge when the number of criteria increases to a level where weights become relatively small. Thus, this model becomes like a non-weighted model at which criteria weights don’t have an impact on the total scores.
This model is meant to add objectivity to our decision-making process; it is not meant to replace our own judgment. When the weighted scores are close, this indicates that a slight change in the weight of a criterion and/or a change in the subjective scores could significantly change the decision. For this reason, a weighted scoring model is often viewed as a tool that is meant to be revised as we learn more about what truly matters to us and/or the organization.
