Chapter 11. Monitoring and Controlling
11.5 MS Project Tutorial
This MS Project tutorial will elaborate on how to conduct an EVM analysis. Table 11.6 provides a project with 15 activities.
Table 11.6: Project Activities
| Activity | Duration (weeks) | Predecessors |
| A | 2 | — |
| B | 3 | — |
| C | 1 | A, B |
| D | 3 | C |
| E | 2 | C |
| F | 2 | D, E |
| G | 3 | E |
| H | 4 | F, G |
| I | 2 | H |
| J | 6 | I |
| K | 4 | J |
| L | 3 | J |
| M | 2 | J |
| N | 2 | K, L, M |
| O | 1 | N |
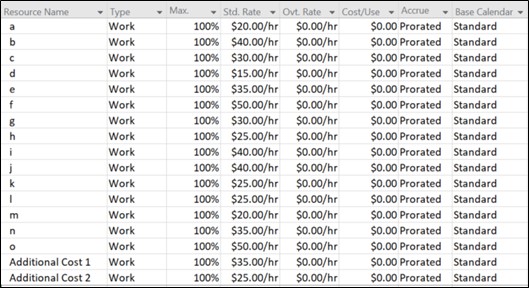
In this project, the resources that are assigned to each activity are given in Table 11.7. All the resources are “Work” type resources which means that they are either people or equipment.
Table 11.7: Resources and Costs
| Resource Name | Standard Rate | Activities |
| a | $20.00/hr | A |
| b | $40.00/hr | B |
| c | $30.00/hr | C |
| d | $15.00/hr | D |
| e | $35.00/hr | E |
| f | $50.00/hr | F |
| g | $30.00/hr | G |
| h | $25.00/hr | H |
| i | $40.00/hr | I |
| j | $40.00/hr | J |
| k | $25.00/hr | K |
| l | $25.00/hr | L |
| m | $20.00/hr | M |
| n | $35.00/hr | N |
| o | $50.00/hr | O |
| Additional Cost 1 | $35.00/hr | C |
| Additional Cost 2 | $25.00/hr | F |
Under the View tab, we click the “Resource Sheet”. Then, we can type the resource names and costs as seen in Table 11.7. The Resource Sheet on MS Project is given in Figure 11.3.
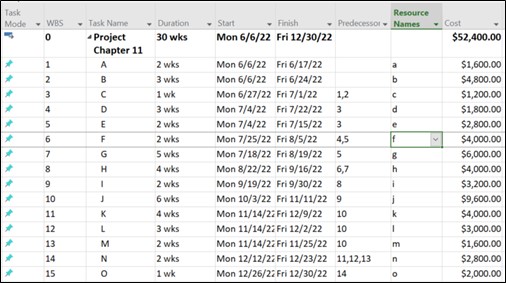
Let’s select all the resources except additional costs from the drop-down menu for each resource on the Gantt Chart view. Besides, we add a new column “Cost” to the left of “Resource Names”. As can be seen in Figure 11.4, the total estimated cost of the project is $52,400. This figure would be also our BAC (Budget at Completion).
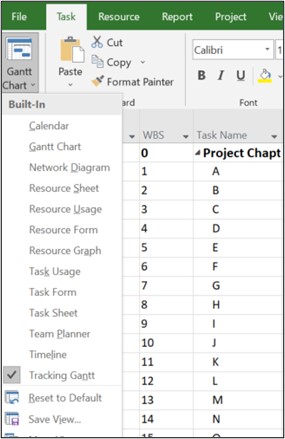
Under the “Task” tab, we can select “Tracking Gantt” from the drop-down menu (Figure 11.5).
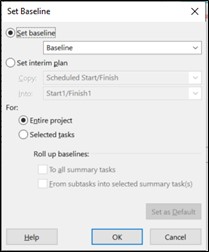
In order to create schedule and cost baselines, we must create a baseline by clicking “Set Baseline” under the “Project” tab. We can click OK as shown in Figure 11.6.
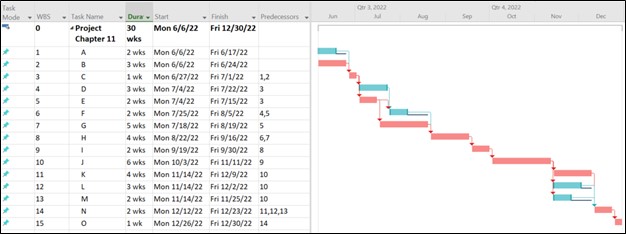
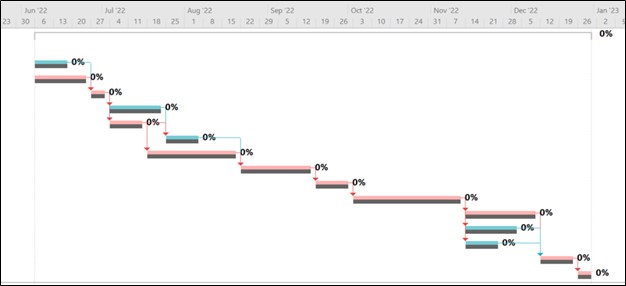
The Tracking Gantt Chart is shown in Figure 11.7. As we haven’t indicated any progress yet, all the progress percentages are zero percent. Each bar is now composed of two horizontal parts. The lower part which is darker displays the baseline.
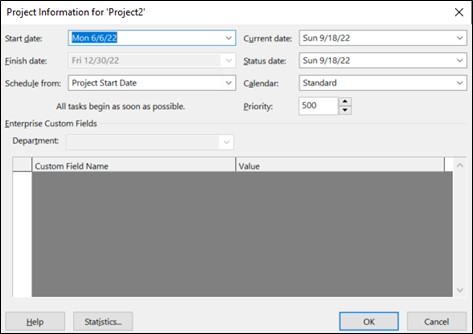
The project started on June 6, 2022. The estimated completion date is December 30, 2022. Let’s assume that some time passed in the project. Let’s make the current date September 18, 2022. Under the “Project” tab, click “Project Information”. Changing the current date won’t suffice (Figure 11.8). It will help us to see the date on the Gantt Chart. Rather, we need to change the status date to create a scenario as of September 18, 2022.
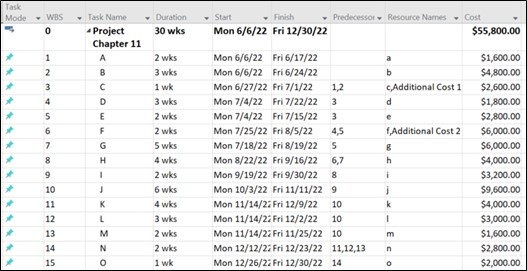
Now, we can change the completion percentages for each activity, and add “Additional Resources” to create the impression as if we made some progress on activities, and spent more money on some of the activities. As indicated in Table 11.7, additional costs are added to activities C and F (Figure 11.9). The project cost changed to $55,800 with the additional costs from its cost baseline of $52,400.
As shown in Table 11.8, we will also change the completion percentages for each activity.
Table 11.8: Completion Percentages for the Activities
| Activity | Completion Percentage |
| A | 100 |
| B | 100 |
| C | 100 |
| D | 100 |
| E | 100 |
| F | 100 |
| G | 100 |
| H | 50 |
| I | 0 |
| J | 0 |
| K | 0 |
| L | 0 |
| M | 0 |
| N | 0 |
| O | 0 |
We can use the shortcuts for completion percentages (0%, 25%, 50%, 75%, 100%). Or double-clicking a task opens the “Task Information” window. From the “Percent complete” on this window, we can type any percentage (Figure 11.10).
 Figure 11.10: Shortcuts for Completion Percentages
After we mark the completion percentages for each task, we can see the percentages to the left of each bar on the Gantt Chart (Figure 11.11). Besides, the upper horizontal section of each bar will get darker for 100% completion, and the “Indicators” column will place ticks for these activities. Activity H has a 50% completion. Therefore, its upper horizontal section turned darker red for half of the activity. We should remember that weekends are considered holidays on Microsoft Project (default setting). Therefore, the coverage area may not necessarily display a 50% area on a bar.
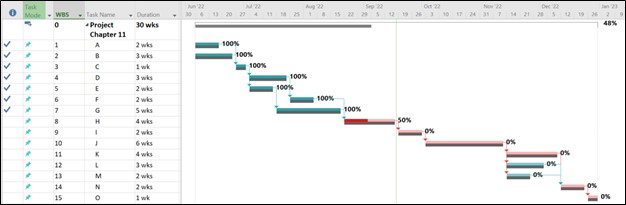
So, our scenario dictates that we finished 100% of activities A, B, C, D, E, F, and G, and 50% of activity H. Besides, we spent more money on activities C and F.
Now, we can open the EVM table. In the View tab, we click Tables and select More Tables. In the new menu window, we choose Earned Value. In the new sheet, we should insert SPI as a new column to the right of the existing “SV” column, and CPI as a new column to the right of the existing “CV” column. Figure 11.12 displays the Earned Value table view as of September 18, 2022. An SPI value of 0.92 indicates that our project is behind schedule. A CPI value of 0.88 indicates that our project has an overrun budget issue. Microsoft Project provides EAC, BAC, and VAC values (Figure 11.12). Our cost baseline was $52,400. If we assume that the CPI value of 0.88 doesn’t change during the rest of the project, we can estimate to pay $59,761 (EAC – Estimate at Completion) by the end of the project, which is $7,361 (VAC – Variation at Completion) more than our cost baseline.
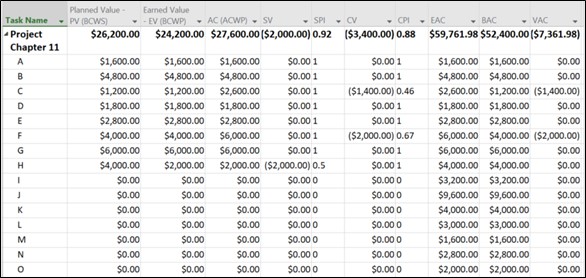
Our schedule baseline was 30 weeks (Figure 11.2). SPI is 0.92 as of September 18, 2022. If we cannot improve this SPI and it remains the same during the rest of the project, there may be a delay of 2.6 weeks [1 – (30 weeks / 0.92)].
