Chapter 7. Scheduling
7.6 Microsoft Project Tutorial
The exercise in Table 7.5 has the same activities, durations, and predecessors as the exercise we used to develop a network diagram. In this exercise, we have added different dependencies (not only F-S), lags (a positive number showing a delay), and leads (a negative number showing an earlier start).
| Activity | Duration (week) | Dependencies | Lag | Predecessors |
| A | 1 | F-S | 0 | – |
| B | 2 | F-S | 0 | – |
| C | 2 | F-S | 0 | A |
| D | 4 | S-S | 0 | A |
| E | 1 | F-S | 0 | B |
| F | 2 | F-S | 0 | C, D |
| G | 3 | F-S | 0 | E |
| H | 1 | F-S | 2 weeks | G |
| I | 4 | F-S | 0 | G |
| J | 1 | F-F | -1 week | F |
| K | 3 |
F-S for H S-F for J |
5 days for J | J, H |
| L | 4 | F-S | 0 | I |
| M | 1 |
F-S for K F-F for L |
1 week for L | K, L |
When we start a new project on Microsoft Project, it is useful to check “Project Summary Task” under the “Format” tab. MS Project gives the row number zero to the project summary task. The question mark at the end of the duration shows that the duration is estimated.

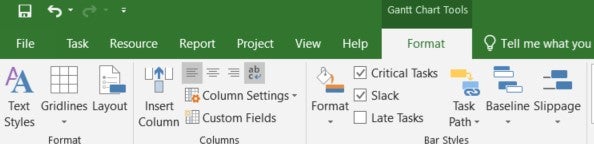
Besides, just in the very beginning, it is of high importance to check “Critical Tasks” and “Slack” under the “Format” tab (Figure 7.21). When we type the tasks (activities), the Gantt Chart will start to highlight the critical and non-critical tasks in red and blue colors respectively.
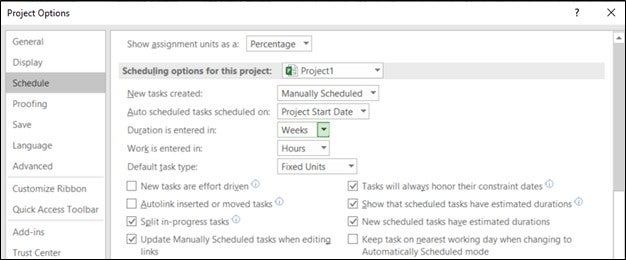
As the durations are in weeks, we should change the settings in the Options under the “File” tab. “Duration is entered in” is changed to “Weeks” (Figure 7.22).
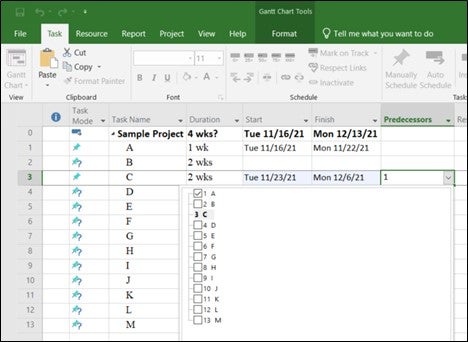
First, we should type each activity on the “Task Name” column and durations on the “Duration” column. Then, we can select the predecessors from the dropdown menu on the “Predecessors” column (Figure 7.23).
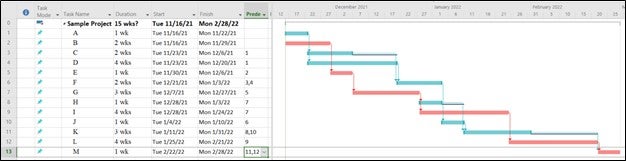
When we finish typing all the activity predecessors, Gantt Chart will be completed on the right side of the window (Figure 7.24). As indicated above, red bars show critical tasks (with zero slack) and non-critical tasks (with slacks). MS Project allows the users to change the colors of the bars.
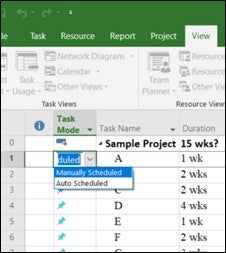
For this exercise, we are not changing the “Task Mode”, which is either automatically scheduled or manually scheduled (Figure 7.25). Project summary task is automatically scheduled since it adjusts the duration, and start and finish dates automatically when activity durations and predecessors are typed.
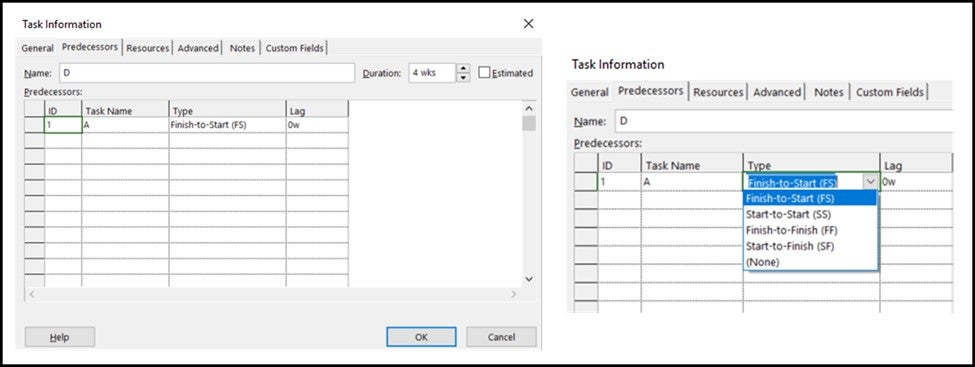
When we double-click a task, the “Task Information” window opens (Figure 7.26). The dependency type is “Finish-to-Start (FS)” as default. Now we can change dependencies as indicated in Table 7.5.
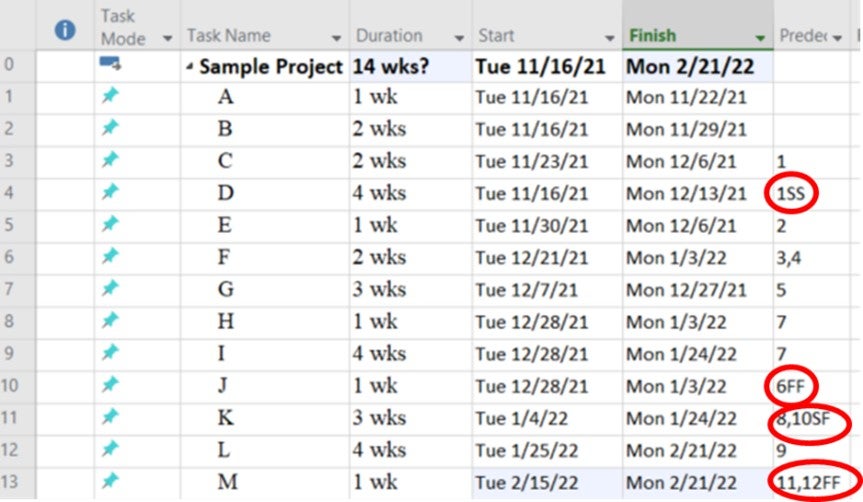
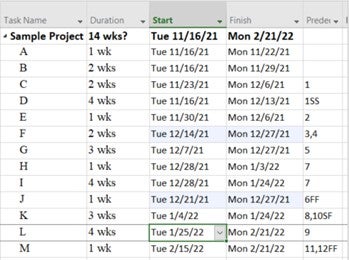
When we are done with predecessor types (dependencies), the predecessors with dependencies different from FS will appear on the “Predecessors” column for the relevant activities (Figure 7.27). These dependencies are shown inside a red circle in Figure 7.27.
After we change the dependencies, it is important to click “Respect Links” under the “Task” tab since the task mode is manually scheduled and the new dependencies may affect the precedence relationships. As can be seen in Figure 7.28, MS Project highlights the boxes in light blue if there is a change.
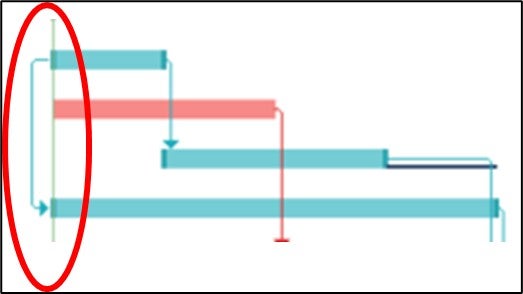
As can be seen in Figure 7.29, the dependency between A and D is not FS anymore D. It is Start-to-Start (SS). Therefore, the arrow starts from the left side of A’s bar on the Gantt Chart and connects to the left side of D’s bar. When it is FS, the arrow starts from the right side of the predecessor and connects to the left side of the successor as can be seen in Figure 7.29 between A and C.
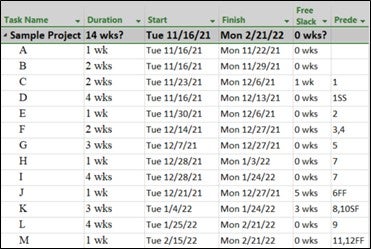
In order to see the slacks for each activity, we can add a new column named “Free Slack” (Figure 7.30). The black underline attached to the left of Activity C in the Gantt Chart also shows the slack (Figure 7.29).
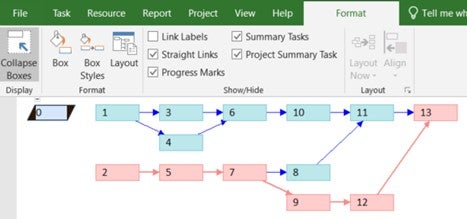
Now we can create an activity network diagram by selecting “Network Diagram” on the dropdown menu that appears when we click the Gantt Chart located on the far-left part of the “Task” tab (Figure 7.31).
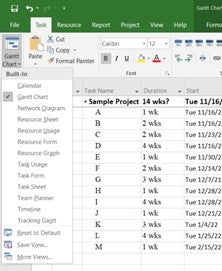
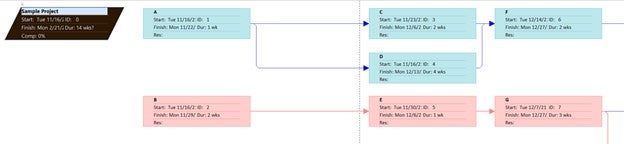
Figure 7.32 displays the network diagram in a non-collapsed format. We should scroll toward the right to see other activities.
In order to see the whole diagram without details, we should click “Collapse Boxes” and check “Straight Links” under the “Network Diagram Tools – Format” tab (Figure 7.33). The network diagram in MS Project illustrates the links in FS dependency. Therefore, it is convenient to see other dependencies on the Gantt Chart view.