Chapter 7. Scheduling
7.5 Creating a Gantt Chart
A Gantt chart is a type of bar chart, developed by Henry Gantt, that illustrates a project schedule. Gantt charts are easy to read and are commonly used to display scheduled activities. These charts display the start and finish dates of project activities. Gantt charts also show the dependency relationships (i.e., precedence network) between activities.
Gantt charts show all the key stages of a project and their duration as a bar chart, with the time scale across the top. The key stages are placed on the bar chart in sequence, starting in the top left corner and ending in the bottom right corner (Figure 7.12). A Gantt chart can be drawn quickly and easily and is often the first tool a project manager uses to provide a rough estimate of the time that it will take to complete the key tasks. The detailed Gantt chart is usually constructed after all WBS activities are identified, an activity list is created, activity durations are estimated, and predecessors are determined.
Let’s continue with our example in table 7.3. The Gantt Chart for the Scope activities was created by using MS Project (Figure 7.19).
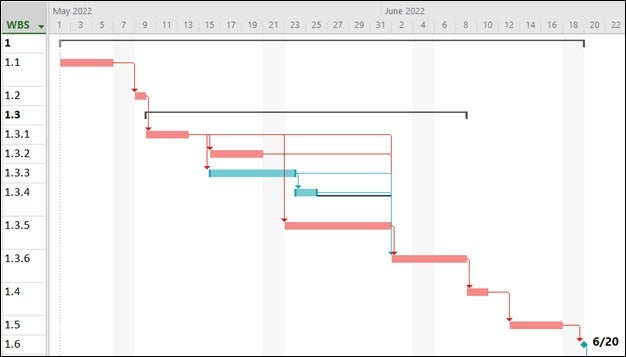
Figure 7.19: Gantt Chart for the “Scope” activities
In the Gantt chart in Figure 7.19, red bars show the critical tasks whereas blue bars illustrate the non-critical tasks. Dependencies between all the activities are Finish-to-Start, which is the most common dependency and the default relationship in MS Project.
