Chapter 7. Scheduling
7.4 Creating an Activity Network Diagram
After we define the activities and estimate their duration, we are ready to create an activity network diagram which is a graphical representation of the logical relationship (i.e., dependencies) among the project activities[1]. Duration estimation can also accompany the creation of an activity network. The process can be iterative, and the project team can move back and forth to refine the activities, durations, and their relationships with other activities.
Activities are carried out in order. Therefore, they have predecessors and successors. They have logical relationships or dependencies which show the sequence in which the activities are to be performed[2]. There are four relationships between activities, which can be indicated as “Finish-to-Start” (FS), “Finish-to-Finish” (FF), “Start-to-Start” (SS), and “Start-to-Finish” (SF). The most common relationship is Finish-to-Start at which we start a successor activity once we finish the predecessor activity. Microsoft Project also uses FS as the default relationship. In the MS Project tutorial below, this topic has been also discussed. A start-to-Finish relationship is very rarely used.
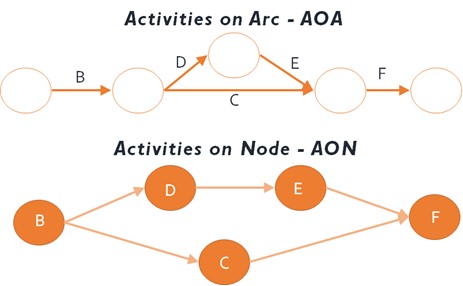
Showing the activities in rectangles or circles, and their relationships (dependencies) as arrows is called a precedence diagramming method (PDM). This kind of diagram is also called an activity-on-node (AON) diagram (Figure 7.1). Another way to show how tasks relate is with the activity-on-arrow (AOA) diagram (Figure 7.1). AOA diagram is traditionally drawn using circles as the nodes, representing the beginning and ending points, and the arrows representing activities. AON is more commonly used and is supported by all project management programs. In this textbook, as is also used by PMBOK Guide Sixth Edition, we are using AON diagrams for creating activity network diagrams. Although we used circles in Figure 7.1 for AON, the most common implementation is to use rectangles. Microsoft Project uses rectangles as well.
7.4.1 Logical Relationships / Dependencies
As explained above, four logical relationships can be used in the precedence diagraming method while creating activity network diagrams. Besides these relationships, we will also discuss lags and leads.
Finish-to-Start (FS) Relationship
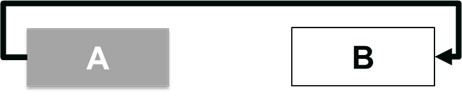
In this relationship, a predecessor activity should be finished in order to start the successor activity. This is the most common relationship between activities. As seen in Figure 7.2, Activity A must be finished to start Project B.

Examples:
- We need to assemble all hardware and network components of a laptop (predecessor) to install the operating system on this laptop (successor).
- We must finish cooking all our meals (predecessor) to start serving them in the dinner (successor).
- We should finish packing all the luggage to start driving to the airport for the holiday.
Lag
A lag is the amount of time a successor activity can be delayed with respect to a predecessor activity[3]. Consider that we should paint one room in our house. We need to apply plaster to walls first (predecessor). When the walls dry, we can paint them (successor). It is an FS relationship. However, we need to wait for two days for the walls to dry. This causes a two-day delay between two activities which is called a lag (Figure 7.3).

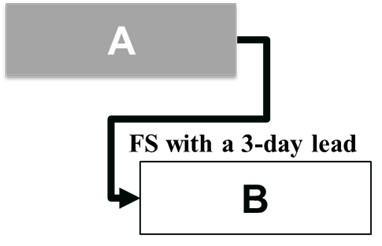
Lead
A lead is the opposite of a lag. A lead is the amount of time a successor activity can be advanced with respect to a predecessor activity[4]. In Figure 7.4, Activity B (successor) can start three days before Activity A (predecessor) finishes. For example, in the project, we should elicit the requirements of stakeholders first. Then, we can start designing the product based on the requirements. If we have ten stakeholder groups, and five of them are key stakeholders, we can start the design before we finish all the elicitation.
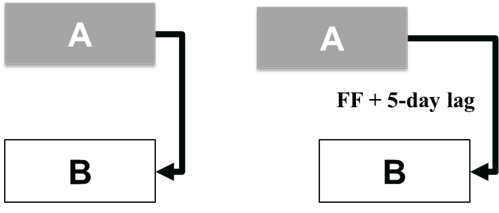
Finish-to-Finish (FF) Relationship
In this relationship, we cannot finish a successor activity (Activity B) if we don’t finish a predecessor activity (Activity A). Therefore, Activity A must be finished to ensure that we can finish Activity B as well (Figure 7.5). These tasks can be carried out in parallel. It is common to have a lag between the predecessor and successor.
Examples:
- We are writing a new textbook, and it has 15 chapters. When we finish writing Chapter 15, we can complete the book.
- The contractor is finishing the installation of gas lines and plumbing in our new house (predecessor – Activity A). Another contractor who will install the kitchen appliances can finish the installation of these appliances (successor – Activity B) when gas lines and plumbing are done. The second contractor will finish the installation of appliances five days after the predecessor activity is completed. So, there is a lag of five days (Figure 7.5).
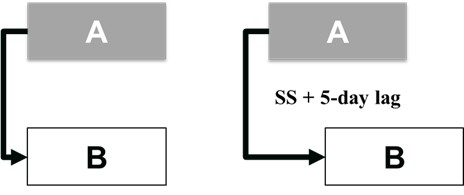
Start-to-Start (SS) Relationship
In this relationship, a successor activity (B) cannot start until we start the predecessor activity (A). Like a finish-to-finish relationship, it is possible to see a lag between these two activities. In Figure 7.6, the relationship on the right illustrates a 5-day lag. Activity B can start five days after Activity B starts.
Examples:
- When developers start coding in a software project, testers may not need to wait until they finish all the coding. They can start testing after the coding starts. However, they may need to wait for several hours or days to start testing since some of the coding should be done so that the testers have an adequate number of lines to test. This delay is named “lag” as explained above and also in the “Finish-to-Finish” relationship.
- We are drafting a user manual for our product (predecessor). This manual must be also reviewed to make it ready for publishing (successor). In order to start this review, we should start drafting the manual.
Start-to-Finish (SF) Relationship
This is the rarest relationship between project activities. Activity B (successor) cannot finish until Activity A (predecessor) activity has started (Figure 7.7). Consider that we developed a new order processing software. In the meantime, we still need to use the current software not to cause any interruptions in our operations. Activity A is “Shutting down the current software” while Activity B is “Making the new software operational”. We can finish Activity B when we start Activity A.
7.4.2 Exercise to Create an Activity Network Diagram
Our exercise to create an activity network diagram starts with Table 7.4 below. We are assuming that all the dependencies are finish-to-start, and there are no lags or leads in this exercise. We will add other types of dependencies as well as lags and leads in the 7.6 Microsoft Project Professional tutorial.
| Activity | Duration (week) | Predecessors |
| A | 1 | – |
| B | 2 | – |
| C | 2 | A |
| D | 4 | A |
| E | 1 | B |
| F | 2 | C, D |
| G | 3 | E |
| H | 1 | G |
| I | 4 | G |
| J | 1 | F |
| K | 3 | J, H |
| L | 4 | I |
| M | 1 | K, L |
We are using rectangular nodes for each activity with labels on them. Different software programs can be utilized to create these nodes. In this exercise, we are using Microsoft Visio. When we click “New” and search “PERT Chart” on Visio, we can select “PERT Chart” to open a new sheet. PERT stands for “Program Evaluation Review Technique”. It was developed by Booz-Allen and Hamilton as part of the United States Navy’s Polaris missile submarine program. PERT is a method for analyzing the tasks involved in completing a project, especially the time needed to complete each task, the dependencies among tasks, and the minimum time needed to complete the total project. Another method, CPM, the critical path method was developed in a joint venture by DuPont Corporation and Remington Rand Corporation for managing plant maintenance projects. The critical path determines the float, or schedule flexibility, for each activity by calculating the earliest start date, earliest finish date, latest start date, and latest finish date for each activity. This will be discussed in detail in the following sections (7.4.3 and 7.4.4). Rather than dealing with both methods separately, project managers use these methods together as they have been treated as a single method over time.
On Microsoft Visio, from PERT Chart Shapes, we drag PERT 1 shape (node) to the blank page. Activities are named as tasks here as is the case with Microsoft Project. We can choose the black color to fill and make the text white color for a good contrast. We can copy this shape, and paste it as needed. In our exercise, we have 13 nodes in total.
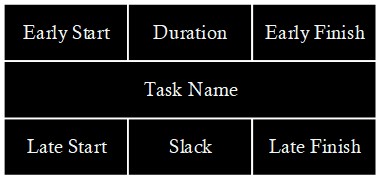
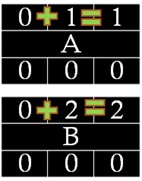
An activity node includes the labels as seen in Figure 7.8.
- Early Start (ES): The earliest time we can start an activity.
- Duration: How long it takes to finish all the tasks in an activity. It can be hours, days, weeks, or months.
- Early Finish (EF): The earliest time we can finish an activity.
- Late Start (LS): The latest time we can start an activity. Some activities may have some flexibilities (slacks or floats) that allow us to have some delay to start without affecting the overall project duration and other activities.
- Late Finish (LF): The latest time we can finish an activity. Based on the slacks (floats), we can finish an activity later than its scheduled completion time.
- Slack (Float): It is the difference between LS and ES, or between LF and EF. Both subtractions generate the same result.
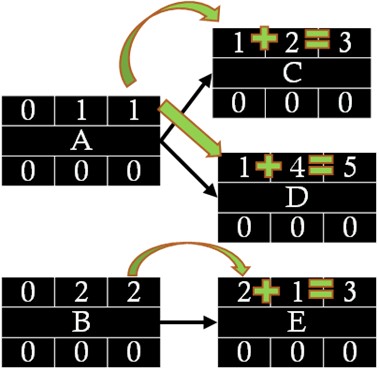
In order to connect nodes, we can drag a line connector to the Visio page and connect two activities (Figure 7.9).
Figure 7.9. Connecting a Predecessor to its Successor (FS dependency)
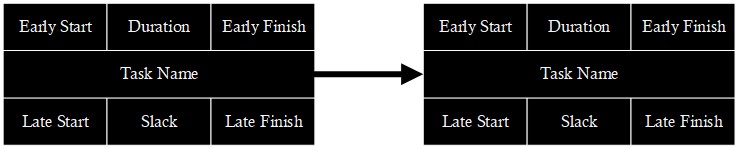
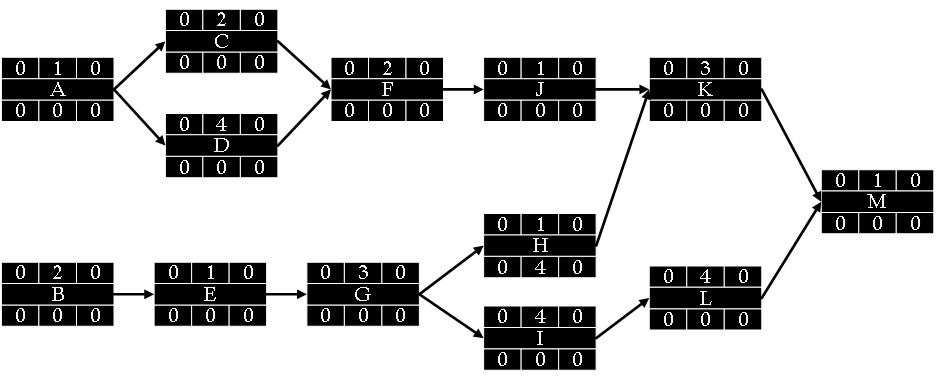
We should place each activity node on the diagram by adhering to their precedence relationships with other activities (Table 7.4). After we connect all the nodes, we can type the duration for each activity as can be seen in Figure 7.10. All other parts in the nodes are zero for now. Besides, as all the dependencies are finish-to-start, the arrows (connectors) start from the right side of a predecessor activity and finish on the left side of a successor activity. For instance, when we finish Activity A, we can start both Activity C and Activity D. When we finish both, we can start Activity F.
7.4.3 Forward Pass:
Now, we can start with a forward pass to determine the early start and early finish dates, and on the last activity, the overall time to finish the whole project. It is an additive move through the network from start to finish.
- For two starting activities (A and B), ES is marked zero, which means that it is the very first day of the project (Figure 7.11).
- We add ES to the duration for each activity to find EF. For A, EF is (0+1) = 1 week, and for B, it is (0+2) = 2 weeks. It means that we can finish A at the end of the first week, and finish B at the end of the second week (Figure 7.11).
- Then, we carry the EF time to the nodes immediately succeeding the recently completed nodes (predecessors). C and D inherit 1 (EF) from A, and it becomes ES for both successor activities. For E, we pass 2 (EF for B) to E as the ES time. Then, we add new ES times to the duration of activities to find the EF for new successors (Figure 7.12).
- At a merge point, as is the case when C and D merge at F, we pass the highest EF time of predecessors (C and D) to the successor activity (F) (Figure 7.13). EF time of D becomes ES time for F.
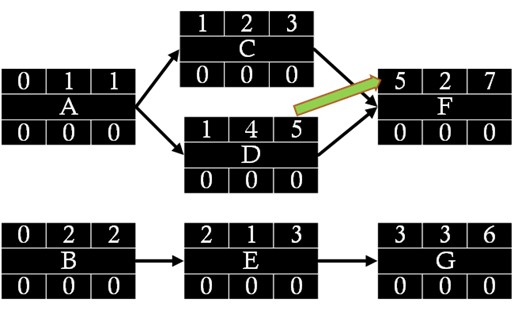
- When the forward pass is done, we can generate all ES and EF times for all the activities. The EF of the last activity (M) gives us the overall duration of the project which is 15 weeks (Figure 7.14).
7.4.4 Backward Pass
Before starting the backward pass process, we should explain the critical path which is the path through the network that results in the latest completion date of the project. If any activity on the critical path is delayed, the completion of the project will be delayed by an equal amount. It is the path with the greatest total duration. Therefore, we can add the amount of time estimated for the duration of each activity to the previous activity to determine which path through the network has the longest total duration. As we will explain below, slack will be zero for all the activities on the critical path.
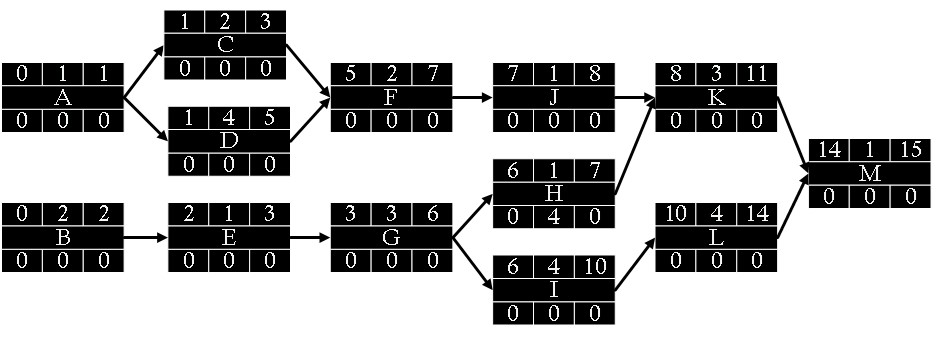
After we complete the forward pass process for all the activities, we can start backward pass by moving from the last activity to the starting activities. It is a subtractive move through the network from finish to the start. In our exercise, the last activity is M with a one-week duration, an ES of 14 weeks, and an EF of 15 weeks which also indicates the overall duration of the project.
- Late Finish (LF) for the last activity M is passed from EF (15 weeks). Then, we subtract LF from the activity duration to find the Late Start (LS). It is (15-1) = 14 weeks (Figure 7.15).
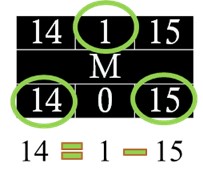
- Now, it is possible to compute slacks for each activity. It is the difference between LS and ES, or between LF and EF. Both calculations will generate the same result. For Activity M, it is (14-14) or (15-15), which is zero. Therefore, there are no slacks for this activity. We don’t have any flexibility for this activity. We cannot have any delays to start the activity or to finish it. The activities where slack is zero are critical.
- Then, we carry back the LS time to the nodes immediately preceding the successor node. K and L inherit 14 (LS) from M, and it becomes LF for both predecessor activities. Then, we subtract LF times from the duration of activities to find the LS for these predecessors (Figure 7.16). The slack for L is (10-10) or (14-14), which is zero. Therefore, L is also a critical activity. The slack for K is (11-8) or (14-11), which is 3. It means that we can wait for an additional three weeks to start K because we need to wait until week 14.
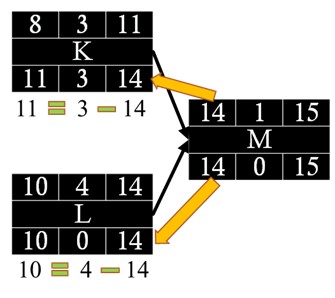
Figure 7.16: Passing LS times to successors as LF times
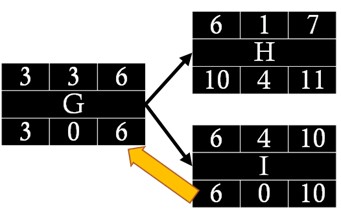
- At a burst point, as is the case when G is followed by two successors, H and I, we pass the lowest LS time of successors (H and I) to the predecessor activity G as its LF time. Therefore, 6 becomes the LF for Activity G (Figure 7.17).
- When the backward pass is done for all the activities, we can generate all LS and LF times as well as slack times for all of them (Figure 7.18). Thus, we can determine the critical path where the total slack is zero.
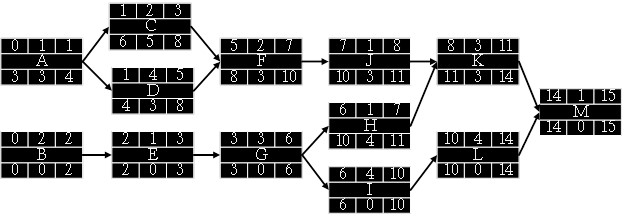
The critical path of this project is B – E – G – I – L – M. It is also the longest path. We need to start and finish all these six activities on their scheduled time not to cause any delay in the overall project. Non-critical paths are:
- A – C – F – J – K – M: 1+2+2+1+3+1=10 weeks
- A – D – F – J – K – M: 1+4+2+1+3+1=12 weeks
- B – E – G – H – K – M: 2+1+3+1+3+1=11 weeks
We should always keep in mind that the WBS is not a schedule, but it is the basis for it. The network diagram is a schedule but is used primarily to identify key scheduling information that ultimately goes into user-friendly schedule formats, such as milestone and Gantt charts. The network diagram provides important information to the project team. It provides information about how the tasks are related, where the risk points are in the schedule, how long it will take as currently planned to finish the project, and when each task needs to begin and end.
Schedules must be communicated to project stakeholders. Generally speaking, stakeholders want to know when the work will be completed. Once the completion date is determined, it is important to confirm whether this date can meet the expectations of the stakeholders, in particular the project sponsor, and internal or external clients. Once timeline commitments have been made, stakeholders must be kept up to date on any delays that will cause deviation from the agreed-upon schedule.
- Project Management Institute. (2017). A guide to the Project Management Body of Knowledge (PMBOK guide) (6th ed.). Project Management Institute. ↵
- Project Management Institute. (2017). A guide to the Project Management Body of Knowledge (PMBOK guide) (6th ed.). Project Management Institute. ↵
- Project Management Institute. (2017). A guide to the Project Management Body of Knowledge (PMBOK guide) (6th ed.). Project Management Institute. ↵
- Project Management Institute. (2017). A guide to the Project Management Body of Knowledge (PMBOK guide) (6th ed.). Project Management Institute. ↵
